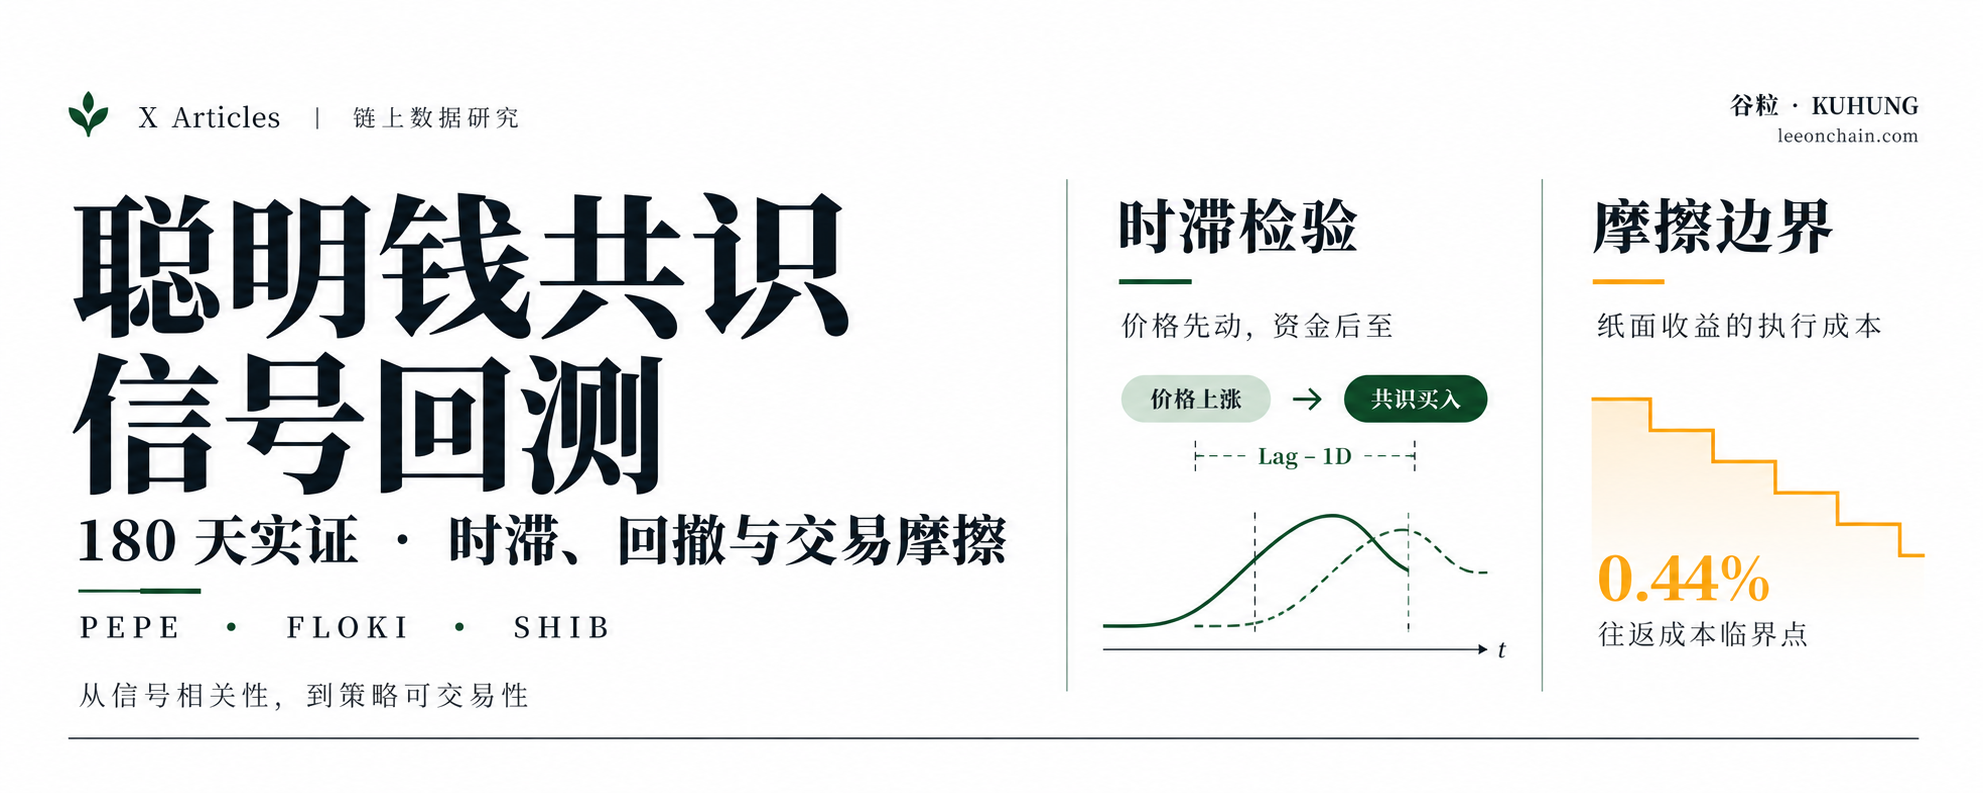
Public on-chain dashboards frequently promote "smart money net accumulation" as an omniscient signal for buying dips. When multiple high-win-rate labels accumulate the same token simultaneously, retail traders tend to execute market buy orders immediately.
However, aligning trade execution logs against subsequent price trajectories reveals consistent underperformance. Following broadcast wallet alerts typically results in purchasing at short-term momentum peaks and absorbing prolonged drawdown during subsequent consolidations.
This breakdown stems from conflating correlation with causation. Treating contemporaneous or lagging order flow within non-stationary time series as a directional predictive indicator is a primary cause of copy-trading failure.
Across prior articles in this research series, we established foundational macro public chain indicators, structured a four-step tracking tool workflow, audited raw smart money leaderboards to eliminate the 100% win-rate distortion, and isolated 76% of operational transfer noise from CEX sweeps and market-maker hedging.
As the concluding installment of this research sprint, this paper takes 908 audited independent DEX Trader profiles and aligns 180 days of daily micro-transaction logs across PEPE, FLOKI, and SHIB between March 25, 2026, and September 22, 2026. We conduct cross-correlation lag evaluations and deterministic backtests, quantifying the exact threshold where execution friction from DEX slippage and gas fees erodes theoretical paper alpha.
01 Consensus Model Architecture and Anti-Spoofing Filters
Isolated on-chain addresses are vulnerable to wash trading, token air-drop manipulation, and internal entity routing. Assessing aggregate smart money flows requires a cross-wallet consensus model rather than monitoring individual accounts.
The foundation of the consensus model rests on quality segmentation. Our profile audit identified distinct statistical profiles across two primary cohorts:
- Smart DEX Traders (908 audited wallets): Moderate trade counts (mean 33.0 trades), disciplined holding horizons (mean 943.0 hours, median 759.0 hours), verified round-trip closures, a mean win rate of 91.8%, and mean realized profits of $41,737;
- Early Holders / Capital Whales (1,004 wallets): Higher activity (mean 62.4 trades), extended holding horizons (mean 1,209.8 hours, median 1,030.3 hours), with nominal profits generated primarily by passive liquidation of seed tokens rather than secondary market timing.
Our consensus model restricts its universe strictly to the 908 audited DEX Traders, excluding early whales and market-maker entities. For calendar day , the system aggregates micro-transactions from pool routing contracts across target assets to derive two primary metrics:
- Smart Money Net Flow:
- Consensus Score: A normalized score combining active buyer ratios with net capital intensity: The metric ranges from $[-1.0, +1.0]$. A bullish consensus signal is confirmed when and .
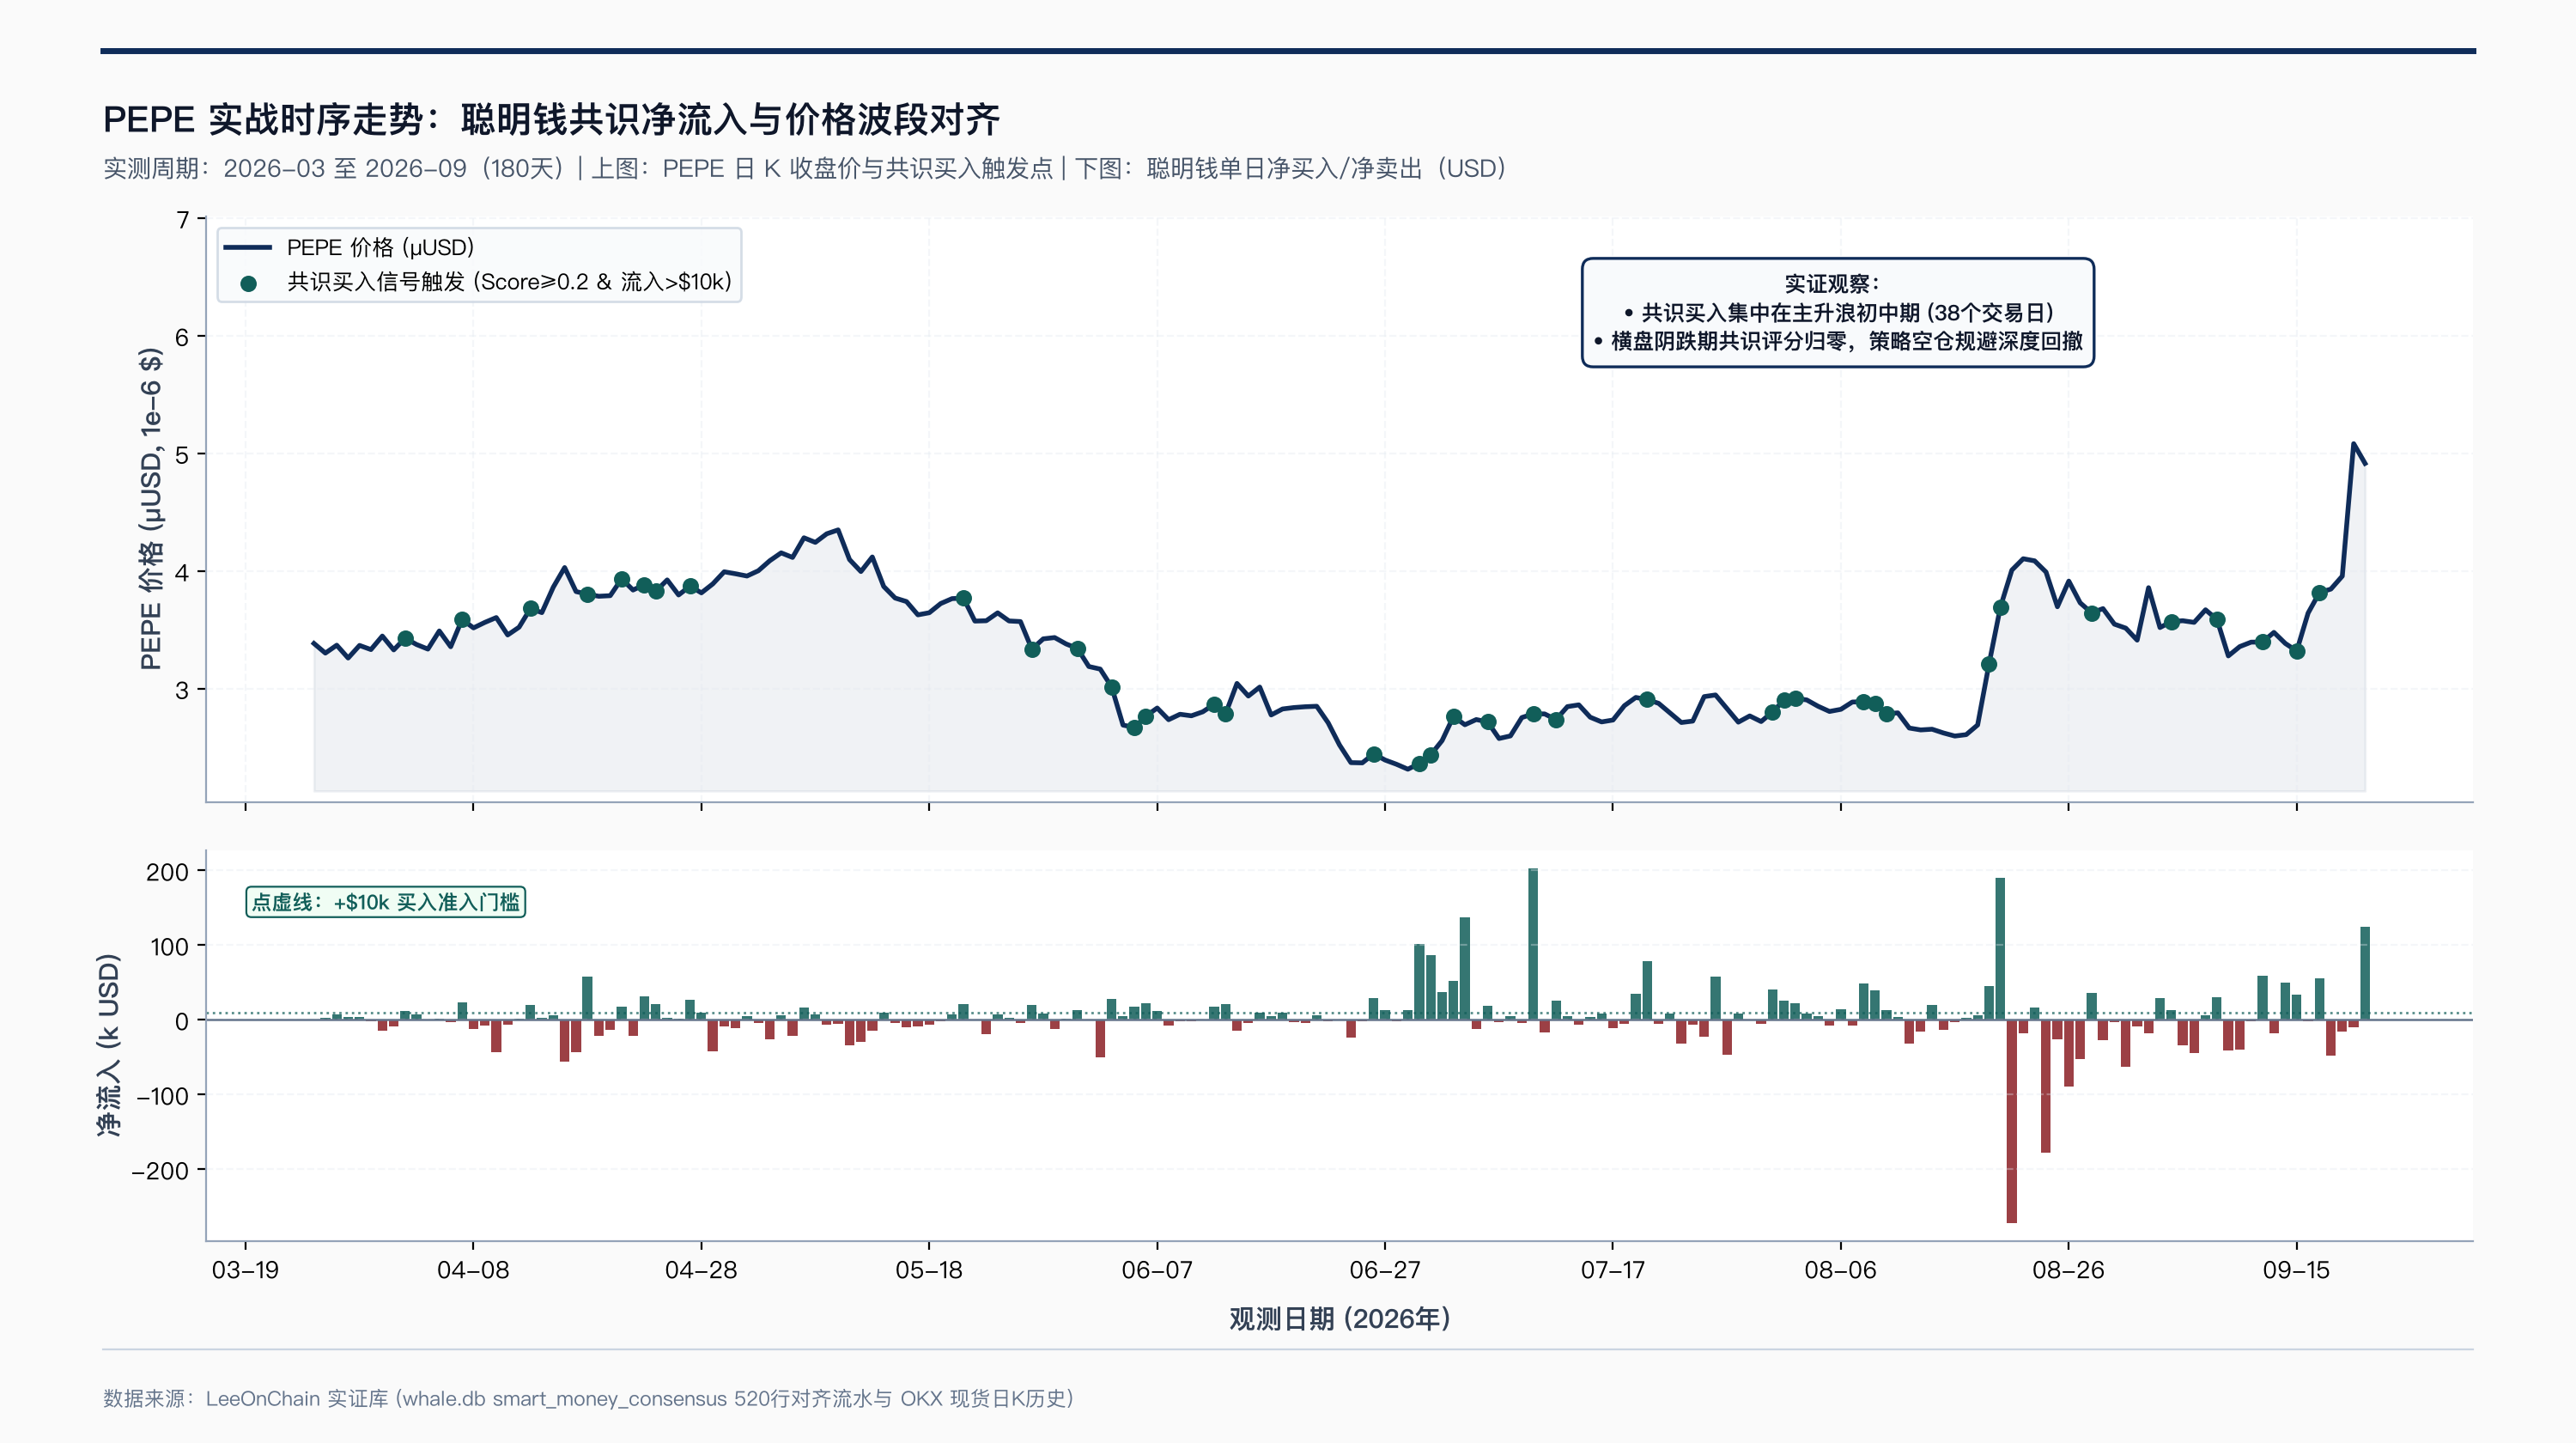
Across 180 days of PEPE spot history, consensus triggers clustered within specific market regimes rather than dispersing evenly. Out of 180 trading days, the bullish consensus threshold was met on only 38 days.
Signal occurrences concentrated along early expansion phases of two distinct upward waves. During the subsequent two-month consolidation and drawdown, smart money net flows flattened rapidly, driving consensus scores to zero or negative territory. This structural quiet period provided the empirical foundation for the strategy to remain in cash during market corrections.
02 Cross-Correlation Lag Evaluation: Momentum Confirmation vs. Lead Predictability
The core quantitative question centers on whether smart money consensus leads secondary market pricing or acts as a lagging momentum confirmation.
We compute cross-correlations across rolling lags. Let represent daily smart money net inflow on day , and let represent daily price return or DEX trading volume growth on day , evaluating lags :
- Positive Lags (): Evaluates predictive capacity of day net flow on future returns at day . A positive correlation indicates predictive alpha;
- Synchronous (): Measures same-day co-movement between capital flow, spot return, and exchange volume;
- Negative Lags (): Evaluates the dependency of day net inflow on past price returns at day $t-|k|$. A positive correlation confirms trend-chasing behavior.
Empirical cross-correlation estimates across PEPE, FLOKI, and SHIB over the 180-day window yield the following profile:
| Lag Horizon () | Net Flow vs. Price Return () | Net Flow vs. DEX Volume () | Statistical Profile and Mechanism |
|---|---|---|---|
| Lag -7D | -0.0253 | -0.0487 | Stale horizon noise |
| Lag -4D | -0.1299 | -0.0084 | Price pullbacks observe inactive consensus |
| Lag -1D | +0.2320 | +0.0784 | Global peak positive correlation, prior-day gains trigger next-day buying |
| Lag 0D | +0.1259 | +0.2379 | Moderate return correlation, intense liquidity and volume resonance |
| Lag +1D | +0.0115 | +0.0627 | Predictive return correlation decays near zero within 24 hours |
| Lag +2D | +0.0245 | +0.0202 | Weak short-term follow-through |
| Lag +3D | +0.1002 | +0.0059 | Minor secondary expansion in select momentum breakouts |
| Lag +7D | -0.0687 | +0.0641 | Inverts negative; mean-reversion pressure emerges |
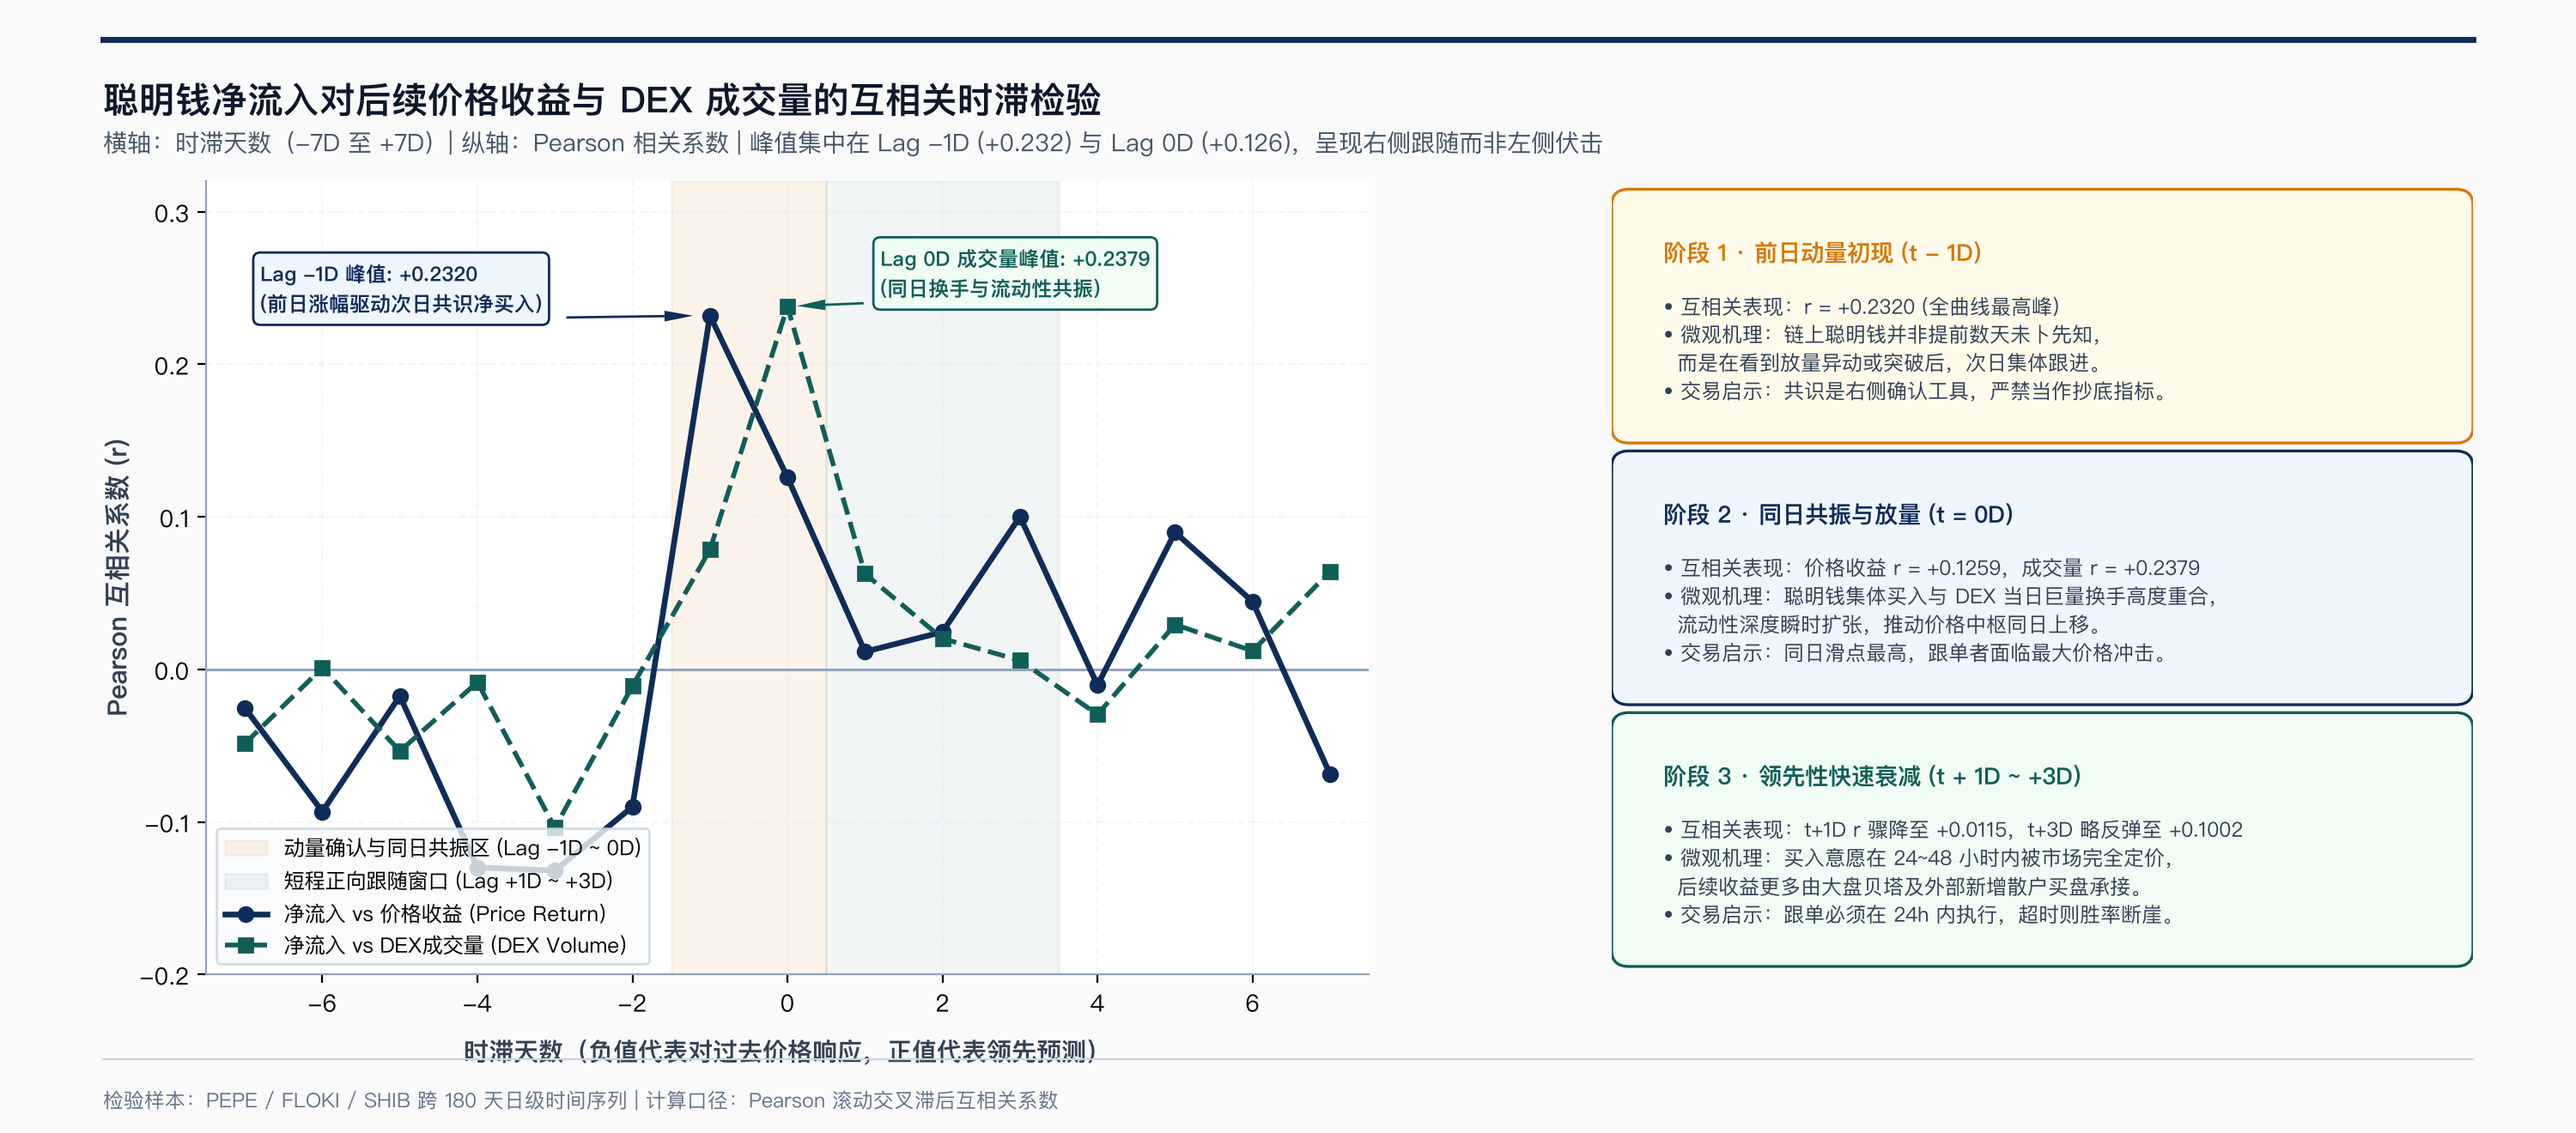
These cross-correlation dynamics yield three definitive conclusions:
1. Momentum Confirmation Strongly Outweighs Advance Positioning (Lag -1D Peak)
The global maximum correlation occurs at (). On a daily timeframe, smart money does not accumulate ahead of time. When an asset experiences a volatility breakout or volume expansion on day , professional on-chain traders detect the breakout and deploy capital on day . Smart money functions primarily as a right-side trend confirmer.
2. Same-Day Volume Concentration Creates Execution Friction (Lag 0D Resonance)
At , the correlation between smart net flow and DEX volume reaches $+0.2379$. Multiple qualified wallets entering on the same day coincides with liquidity pool turnover spikes. Copy-traders entering at this moment face immediate price impact against expanding spreads.
3. Forward Predictability Decays Rapidly (Lag +1D to +3D)
Transitioning into positive horizons, correlation drops from $+0.1259$ at to $+0.0115$ at . The immediate upward price pressure exerted by smart money accumulation is priced into decentralized liquidity pools within 24 hours. While records a modest rebound to $+0.1002$, forward predictability cannot sustain unhedged multi-day holding periods without tight stop-loss rules.
03 Backtest Performance: Excess Returns and Drawdown Truncation
To assess whether consensus signals translate into an executable trading system, we implement a rules-based backtest framework.
To eliminate look-ahead bias, trade execution adheres to deterministic timing:
- Signal Calculation: Executed using market data and consensus tallies finalized at 23:59:59 UTC;
- Trade Execution: If day closes with and , the system enters long at the day Open price;
- Exit Rule: If day closes below threshold criteria, the system exits to cash at the day Open price;
- Benchmark: Passive buy-and-hold (100% spot allocation) across the same 180-day window.
Tested on PEPE over 180 daily periods, comparative metrics summarize as follows:
| Performance & Risk Metric | Consensus Timing Strategy | Buy & Hold Benchmark (B&H) | Mechanism Interpretation |
|---|---|---|---|
| Total Cumulative Return | +13.6% | +45.2% | Benchmark captures full compounding during sustained bull runs |
| Annualized Return | +29.6% | +113.1% | Strategy holds active exposure for only 21.1% of the total period |
| Annualized Volatility | 42.7% | 85.9% | Strategy cuts equity curve volatility in half |
| Maximum Drawdown | 23.5% | 46.8% | Downside risk truncated by 49.8% relative to benchmark |
| Sharpe Ratio | 0.82 | 1.29 | Benchmark Sharpe is elevated by unhedged single-trend momentum |
| Sortino Ratio | 0.46 | 1.64 | Evaluates downside risk-adjusted return |
| Active Market Exposure | 38 Days (21.1%) | 180 Days (100.0%) | Capital remains in cash 78.9% of the time, available for treasury yields |
| Daily Trade Win Rate | 47.4% | 51.1% | Active trade profit factor is positive despite a win rate below 50% |
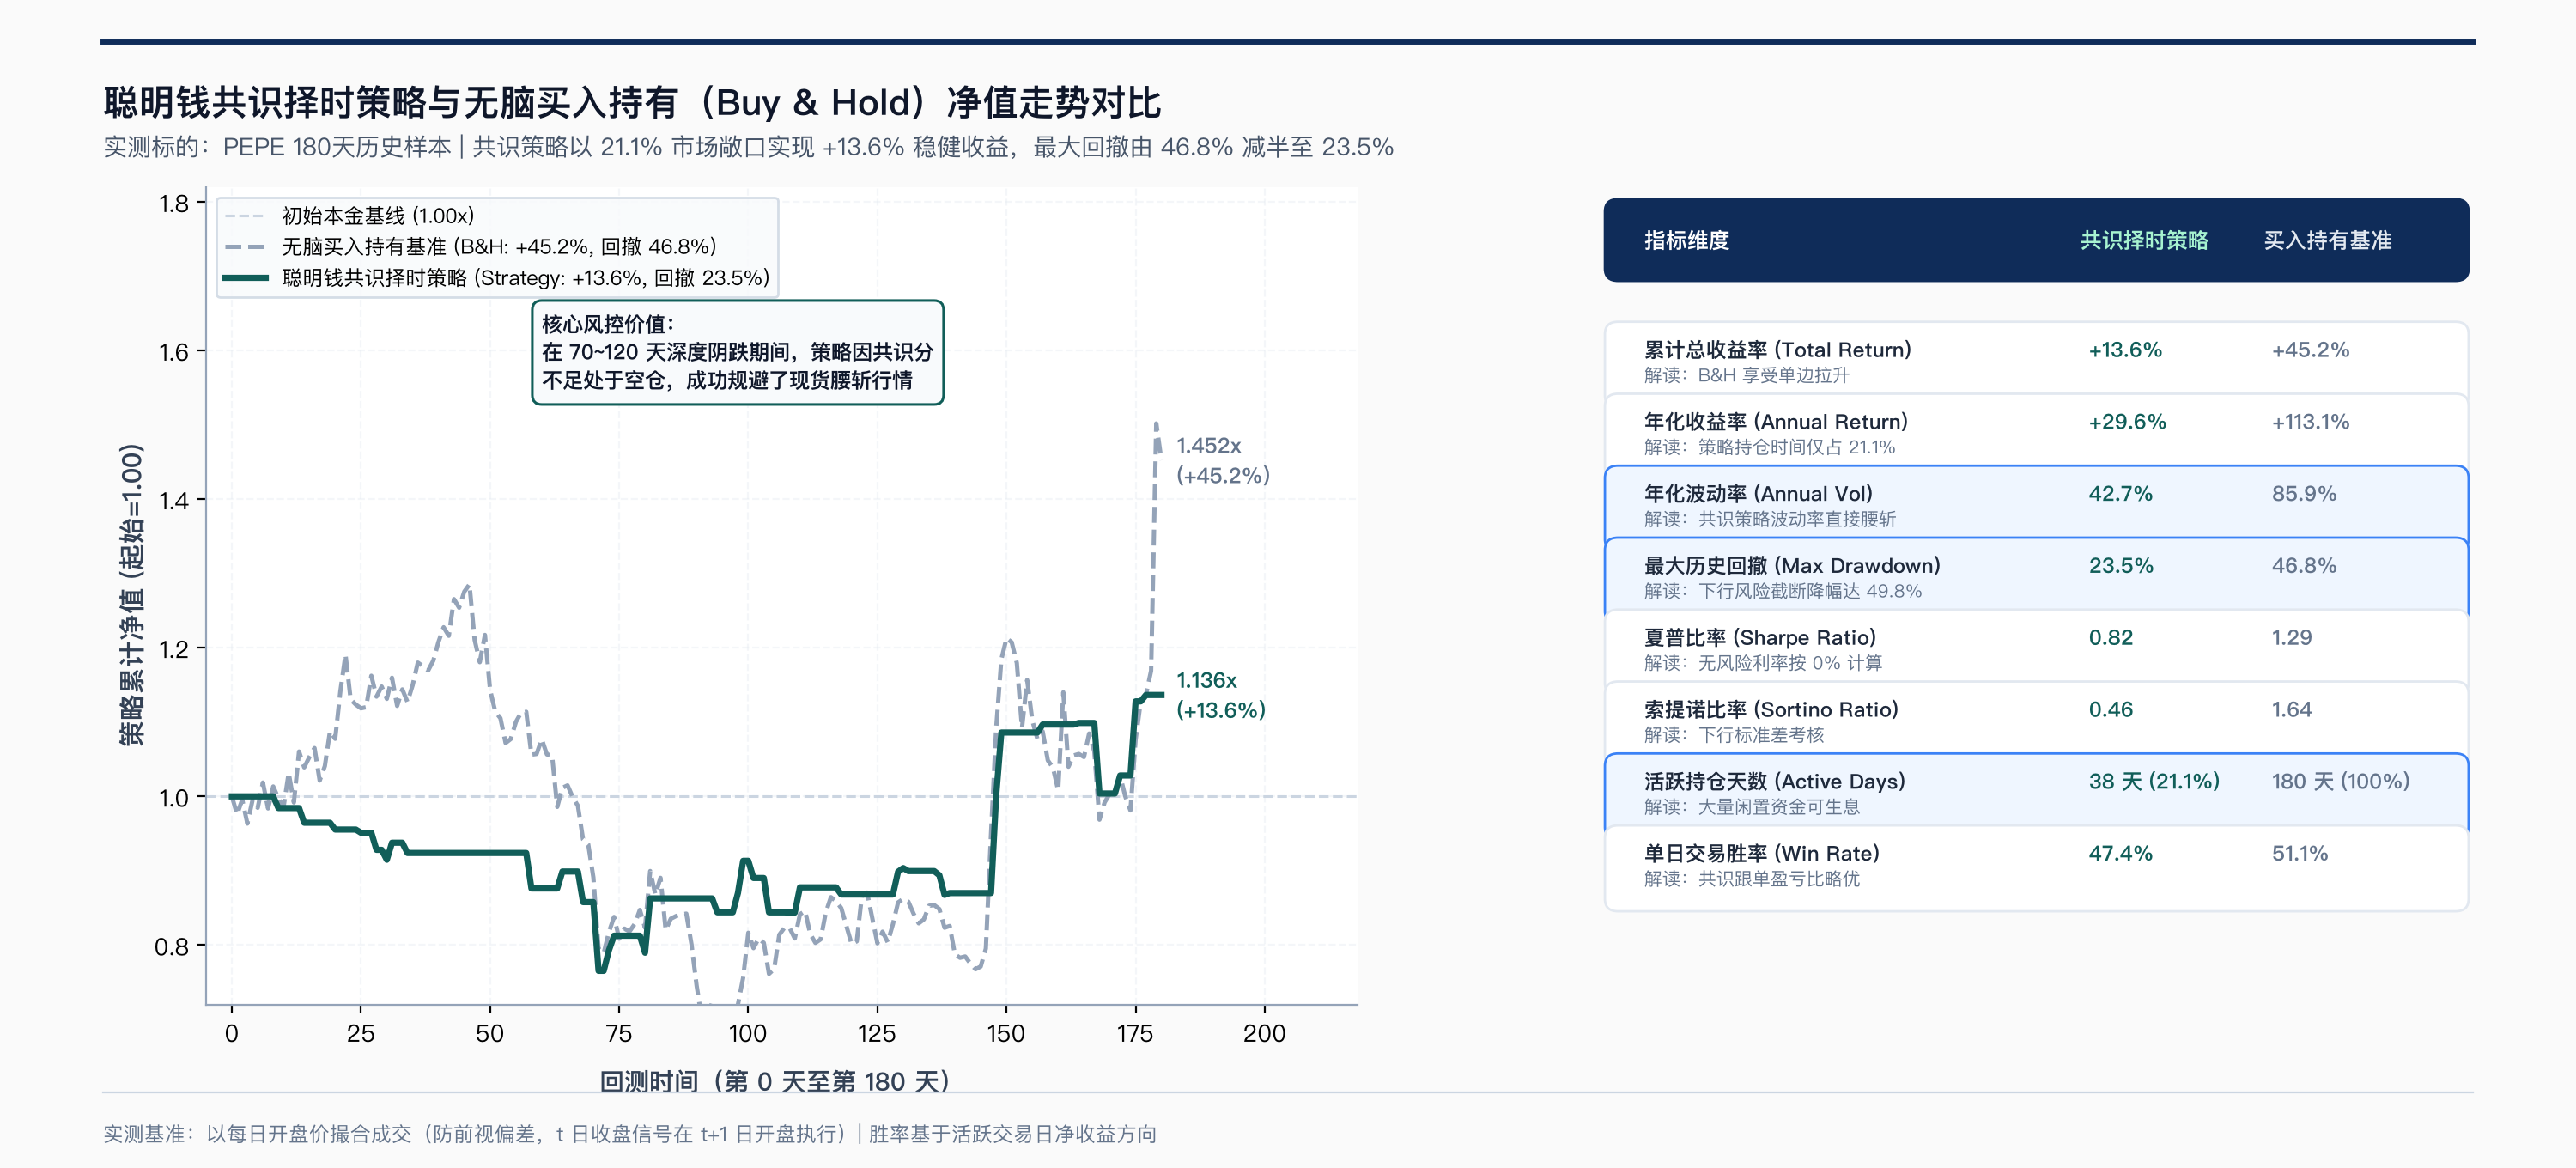
The backtest results clarify the strategic role of on-chain consensus:
1. Consensus Serves as a Defensive Filter Rather than an Alpha Accelerator
During persistent bull runs, the timing strategy lags behind buy-and-hold (+13.6% vs. +45.2%) because it waits for confirmation before entering and exits during consolidation phases.
However, during market drawdowns, buy-and-hold suffered a severe 46.8% drop. The consensus strategy stayed in cash, capping maximum drawdown at 23.5% and reducing annualized volatility from 85.9% to 42.7%. The strategy trades off upside participation in exchange for downside tail-risk protection.
2. Modest Win Rates with Substantially Reduced Capital At Risk
Across the 38 active trading days, the daily win rate reached only 47.4% (18 winning days against 20 losing days), disproving the assumption that smart money tracking yields an 80%+ win rate.
The strategy achieved positive net gains because capital remained in cash for the remaining 142 days, avoiding the bleed of choppy, sideways markets.
04 Physical Execution Frictions: Slippage and Gas Impact
The baseline backtest assumes frictionless fills at daily open prices. In decentralized execution, orders face three structural costs:
- DEX Liquidity Pool Fees: Fixed protocol fees (0.30% per side, or 0.60% round-trip on standard Uniswap pairs);
- Price Impact and Slippage: Thin on-chain pool depth generates 0.20% to 1.00% in execution slippage for trades in the tens of thousands of dollars;
- L1 Gas Fees and MEV Extraction: High-volatility periods inflate network gas costs, while mempool front-running widens realized entry prices.
Over the 180-day backtest, the PEPE strategy triggered 29 round-trip trades (29 entries and 29 exits), averaging a holding period of 1.31 days per trade.
We simulate net returns across various round-trip friction levels (combining pool fees, slippage, and gas costs):
| Round-Trip Friction | Per-Leg Friction | 180-Day Net Return | Total Erosion vs. Paper Alpha | Physical Environment |
|---|---|---|---|---|
| 0.0% (Theoretical Zero) | 0.00% | +13.64% | 0.0% | Idealized backtest model |
| 0.5% (Low Friction) | 0.25% | -1.72% | -15.36% | High-tier CEX execution or deep liquidity venues |
| 1.0% (Standard DEX) | 0.50% | -15.03% | -28.67% | Standard Uniswap V3 swap (0.3% fee + 0.2% slippage) |
| 1.5% (Mild Impact) | 0.75% | -26.57% | -40.21% | Moderate pool liquidity under standard gas |
| 2.0% (Average On-Chain) | 1.00% | -36.56% | -50.20% | Median on-chain friction for retail copy-trading |
| 3.0% (Shallow Pool / MEV) | 1.50% | -52.70% | -66.34% | Shallow pools or trades impacted by sandwich attacks |
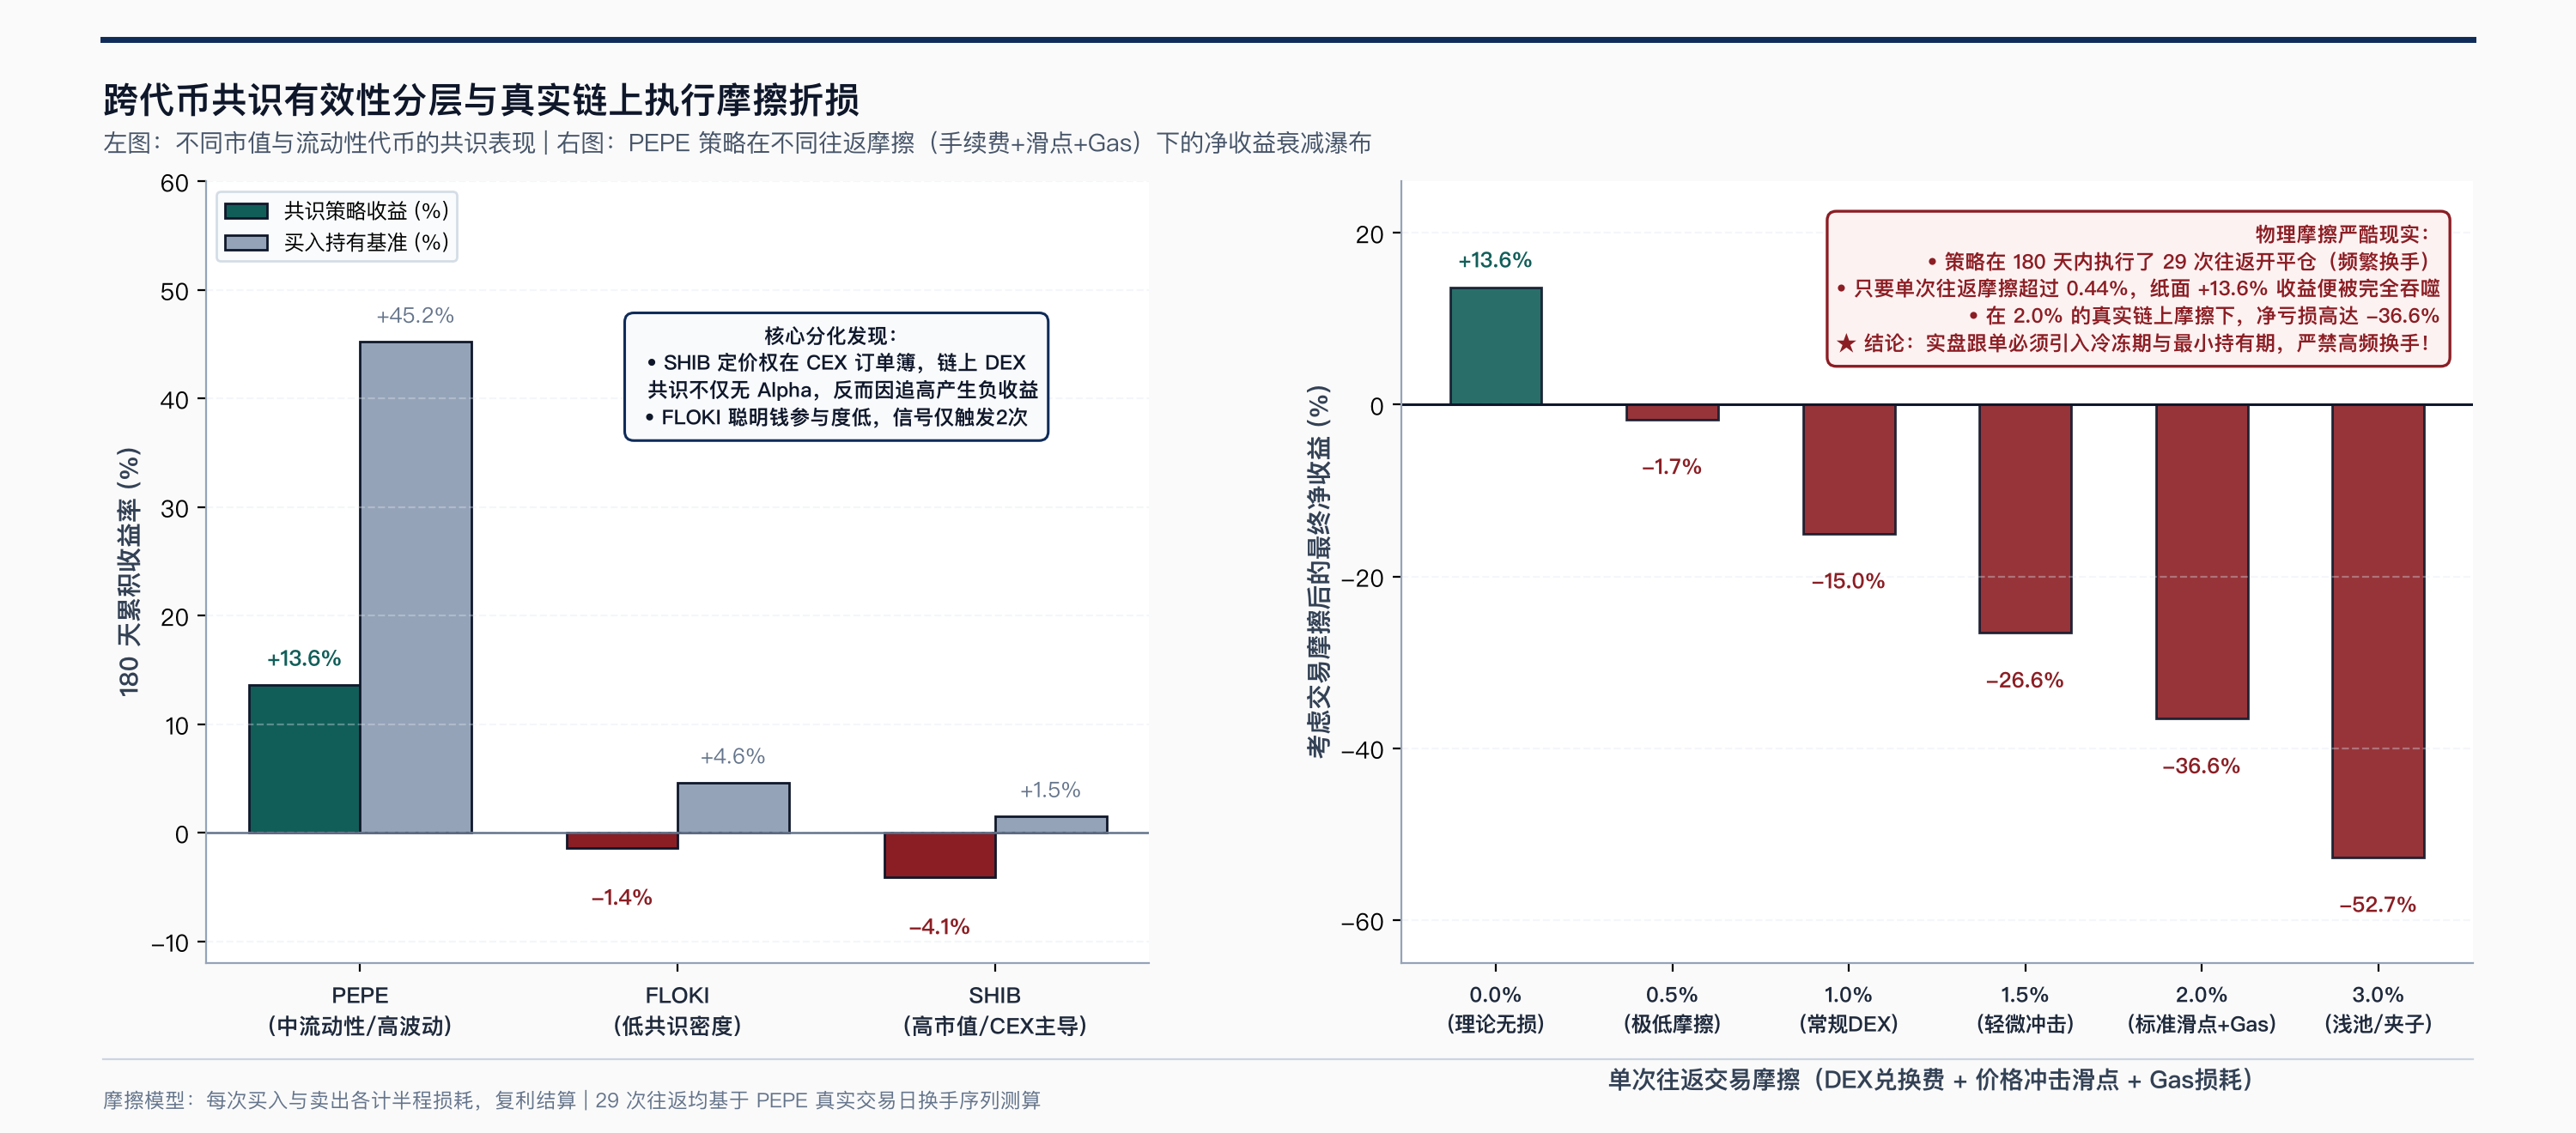
This friction analysis reveals practical limits for on-chain copy-trading:
- Break-Even Friction Threshold at 0.44%: Because the strategy executed 29 round-trips over 180 days, turnover costs compounded quickly. Any total round-trip friction above 0.44% turns the paper +13.6% gain into an outright net loss;
- Standard 2.0% Friction Results in a -36.6% Loss: Retail traders executing market swaps on Uniswap for each signal lose capital to turnover fees and slippage, even when following valid signals.
05 Cross-Token Divergence and Research Series Conclusion
Consensus signal efficacy depends heavily on token market capitalization and liquidity structure. Across the three test assets, performance diverged substantially:
1. PEPE (Medium Liquidity / High Volatility Meme)
Paper return +13.6%, Sharpe 0.82, max drawdown 23.5%. Primary price discovery occurred on decentralized exchanges, where transactions from qualified traders influenced local liquidity and delivered meaningful timing signals.
2. FLOKI (Low Smart Money Engagement)
Paper return -1.4%, Sharpe -0.39, max drawdown 4.1%. Bullish consensus triggered only twice during the 180-day window, indicating that qualified DEX traders were inactive on this asset, leaving the metric flat.
3. SHIB (Large Market Cap / CEX-Dominated)
Paper return -4.1%, Sharpe -1.48, max drawdown 4.1%, win rate 0.0% (0 wins across 2 trades). SHIB maintains billions in market capitalization, with over 95% of trading volume concentrated on centralized order books (Binance, OKX) and perpetual swaps. Decentralized wallet transfers do not drive secondary market pricing for this asset. Applying on-chain DEX signals to large-cap tokens leads to late entries and consistent losses.
Sprint Research Series: Complete Five-Part Synthesis
This report concludes our five-part on-chain data research sprint:
- Part 1 (Macro and Public Chain Metrics): Established macro valuation anchors using Bitcoin MVRV cycles and SOPR thresholds to determine broader market regimes before token selection;
- Part 2 (Tracking Tools How-To): Structured an end-to-end investigative workflow combining GMGN scans, Bubblemaps cluster analysis for bundle detection, and Arkham tracing to verify funding origins;
- Part 3 (Smart Money Calculations and Distribution): Addressed the 100% win-rate distortion by implementing multi-hop DEX routing folds and VWAP matching, separating qualified Traders (908 wallets) from passive Capital Whales (1,004 wallets);
- Part 4 (Transfer Tiering and Signal-to-Noise Ratio): Filtered out 76.6% of operational noise from CEX sweeps and market-maker hedging, formalizing strict 1-hop, 24-hour causal windows, and 0.50 to 1.10 capital ratios for genuine accumulation;
- Part 5 (Consensus Backtesting and Physical Friction, this study): Evaluated 180 days of execution data, showing that consensus operates as a lagging momentum confirmation, halves maximum drawdown (from 46.8% to 23.5%), and identified the 0.44% friction limit for large-cap assets.
06 Practical Guidelines for Traders
Based on our empirical results and execution data, traders using on-chain consensus should apply three operational rules:
- Use Consensus for Right-Side Trend Confirmation and Risk Management, Not for Bottom-Fishing: The cross-correlation peak at Lag -1D indicates that smart money enters after a trend begins. Consensus metrics should be used to confirm existing trends and trigger cash exits during consolidations, rather than to anticipate bottoms during sell-offs;
- Avoid Large-Cap Assets Dominated by Centralized Exchanges: Limit on-chain consensus tracking to medium-cap assets where decentralized exchanges represent a meaningful share of volume. For assets with heavy futures open interest and CEX dominance, rely on order-book data and macro indicators instead;
- Enforce Cooldown Periods to Prevent Turnover Drag: Because round-trip friction above 0.44% erodes paper returns, live systems must enforce minimum holding periods (such as locking positions for 3 to 5 days) and size orders within 2% of available pool liquidity to manage slippage and network gas costs.
This reflects the core philosophy of LeeOnChain: replacing unverified win-rate claims with disciplined data cleaning, transparent statistical validation, and realistic execution constraints, helping traders manage drawdowns and navigate on-chain markets.
Data Sources and Methodology
- On-Chain Consensus Records: Extracted from the
smart_money_consensustable inwhale.db(520 daily rows across PEPE, FLOKI, and SHIB from 2026-03-25 to 2026-09-22, including buyer/seller ratios, net capital flow, and consensus scores). - Historical Market Spot Data: Cached from OKX REST API daily candle endpoints in
data/token_prices_daily.csv. - Wallet Profile Universe: Extracted from the
smart_money_profilestable inwhale.db(908 auditedokTrader profiles and 1,004 Capital Whale profiles). - Backtest and Analytics Pipeline: Executed via the LeeOnChain quantitative codebase:
scripts/analysis/analyze_consensus_lead_lag.pyandscripts/analytics/plot_article_5_figures.py.