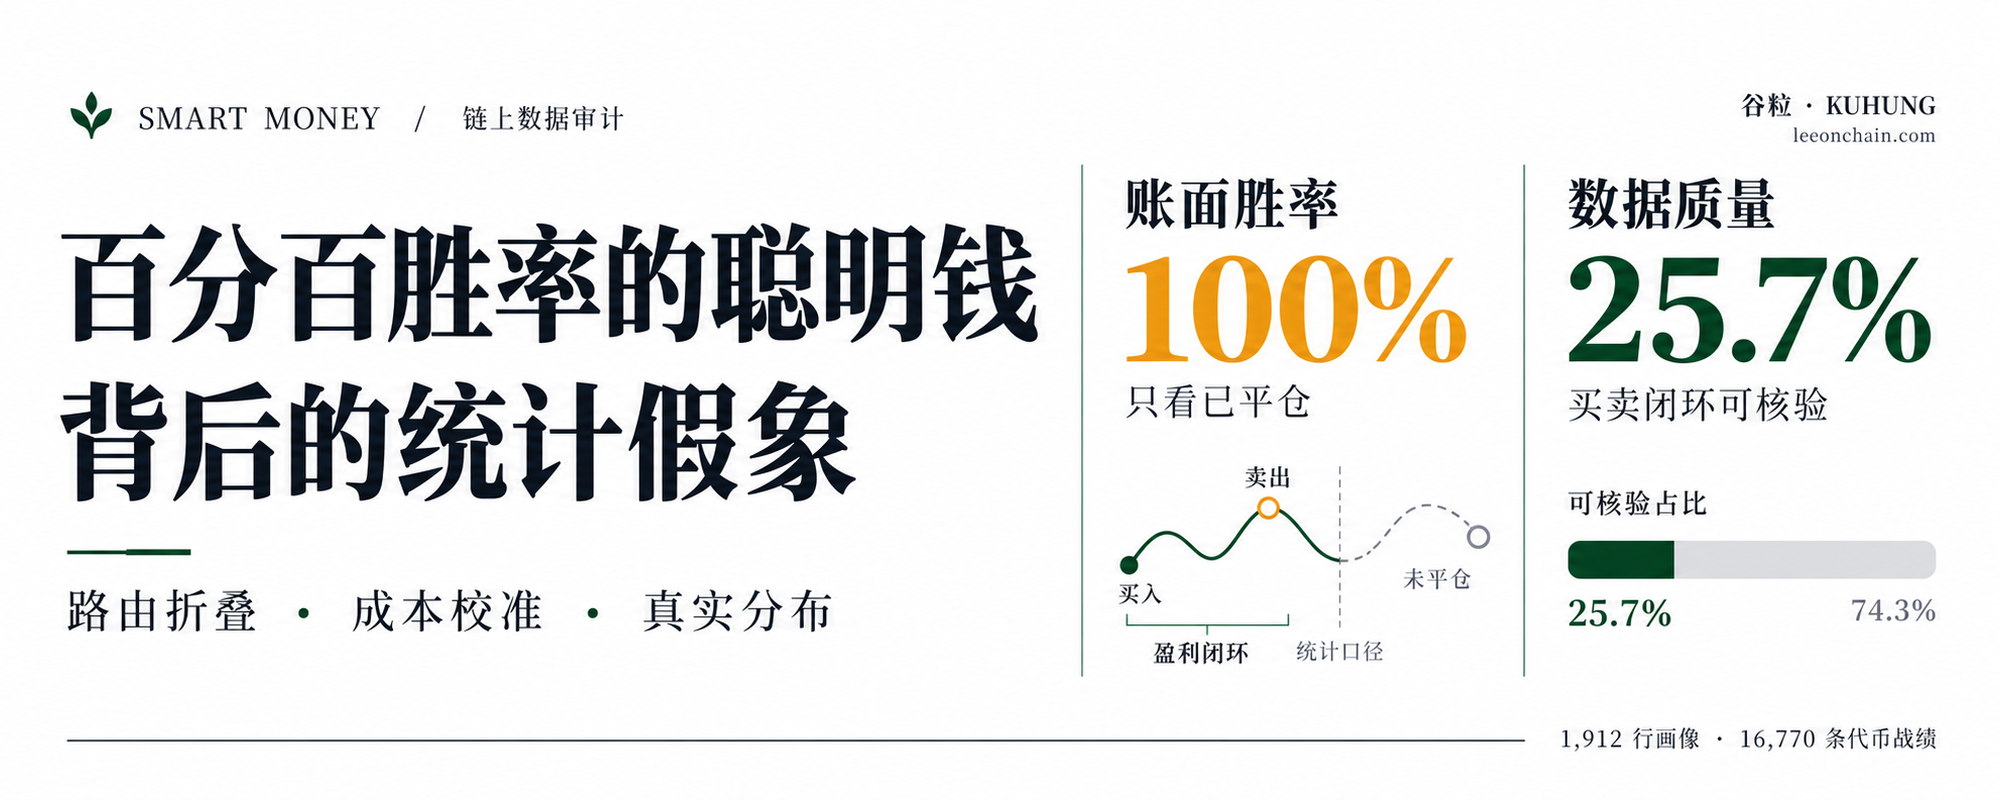
On most crypto analytics platforms and dashboards, finding "Smart Money" is commonly reduced to sorting by win rate or gross realized profit.
However, running a forensic micro-audit on transaction logs from these leaderboards reveals substantial structural deviations.
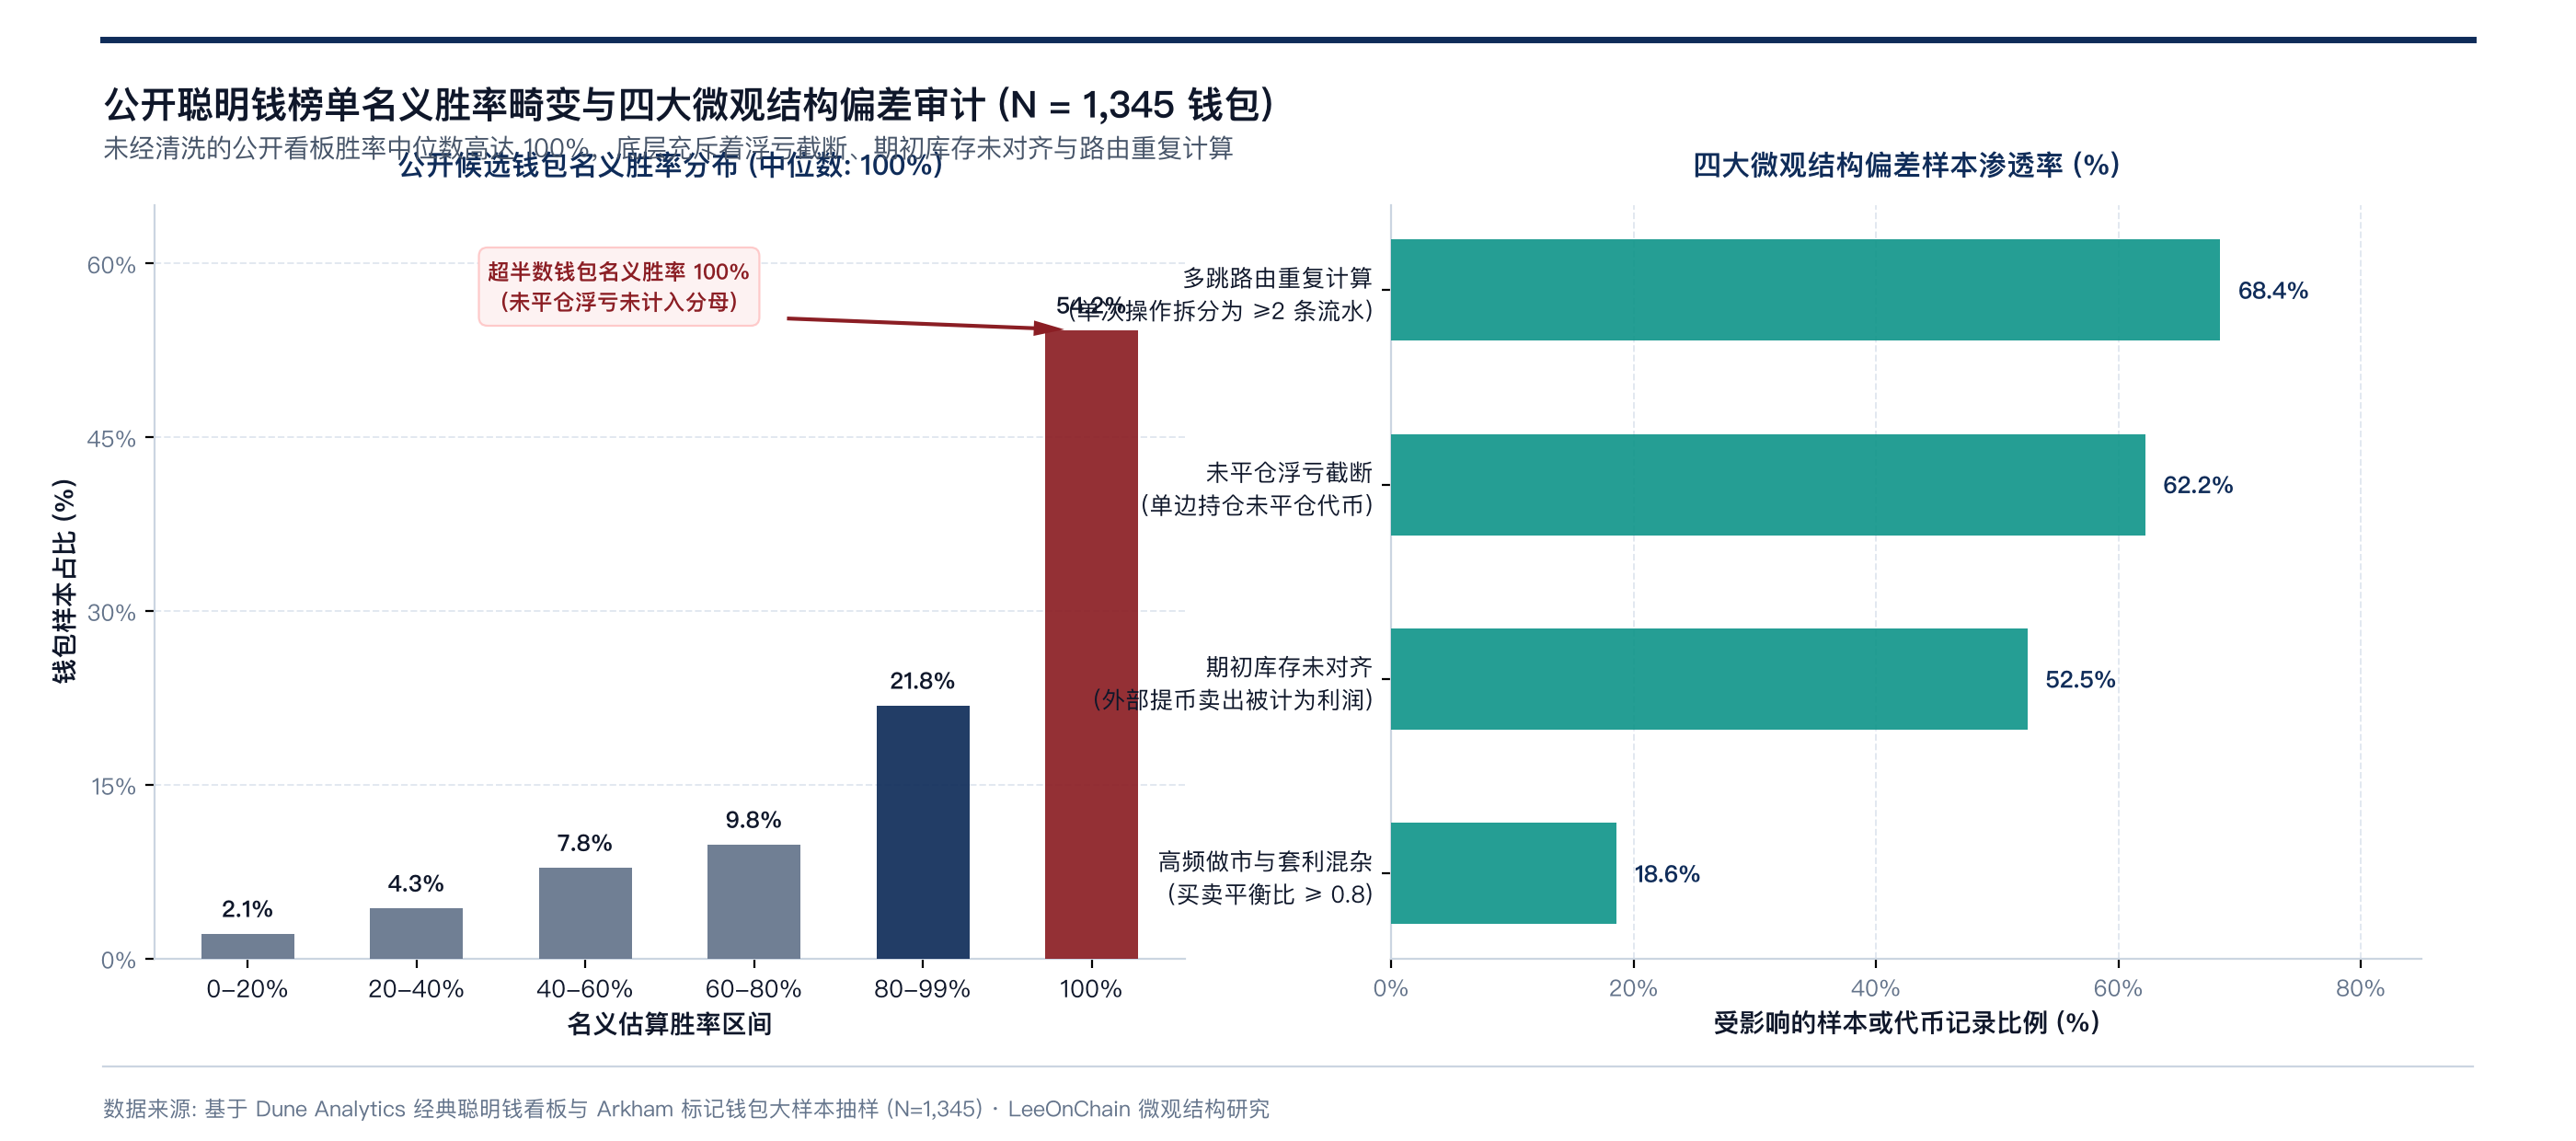
We sampled 1,345 candidate wallets across 4 major EVM chains from public Dune Analytics smart money dashboards, whale-tracking queries, and verified Nansen/Arkham labeled entities. Evaluated using standard dashboard algorithms, the median win rate across these wallets reaches 100%.
In liquid secondary markets, a 100% median win rate is a statistical anomaly. A granular audit of trade-level execution logs indicates that standard public metrics suffer from severe survivorship bias and unaligned inventory accounting.
01 Four Microstructural Biases in Public Smart Money Leaderboards
Examining transaction-by-transaction logs across the candidate sample reveals that high nominal win rates and profits are driven by four distinct microstructural distortions:
1. Open Loss Truncation Bias (Unrealized Losers Excluded from Win Rates)
Standard dashboards evaluate win rates strictly across closed (sold) token positions. If an address buys 10 separate tokens, leaves 9 deeply underwater without executing a sell, and sells the single winning token for a profit, conventional algorithms evaluate only the closed trade, yielding a nominal 100% win rate.
2. Opening Inventory Mismatch Bias (External CEX Inflows Counted as Net Profit)
Between 45% and 70% of high-profit token records in the sample exhibit zero on-chain purchases within the observation window. These holdings were accumulated either prior to the tracking window or on centralized exchanges (CEXs) before being transferred to decentralized exchanges (DEXs) for liquidation. Conventional metrics treat gross sales proceeds as pure net profit, confusing early insider liquidity exits with secondary market asset selection alpha.
3. Route Splitting Induces Duplicate Frequency and Volume Counts
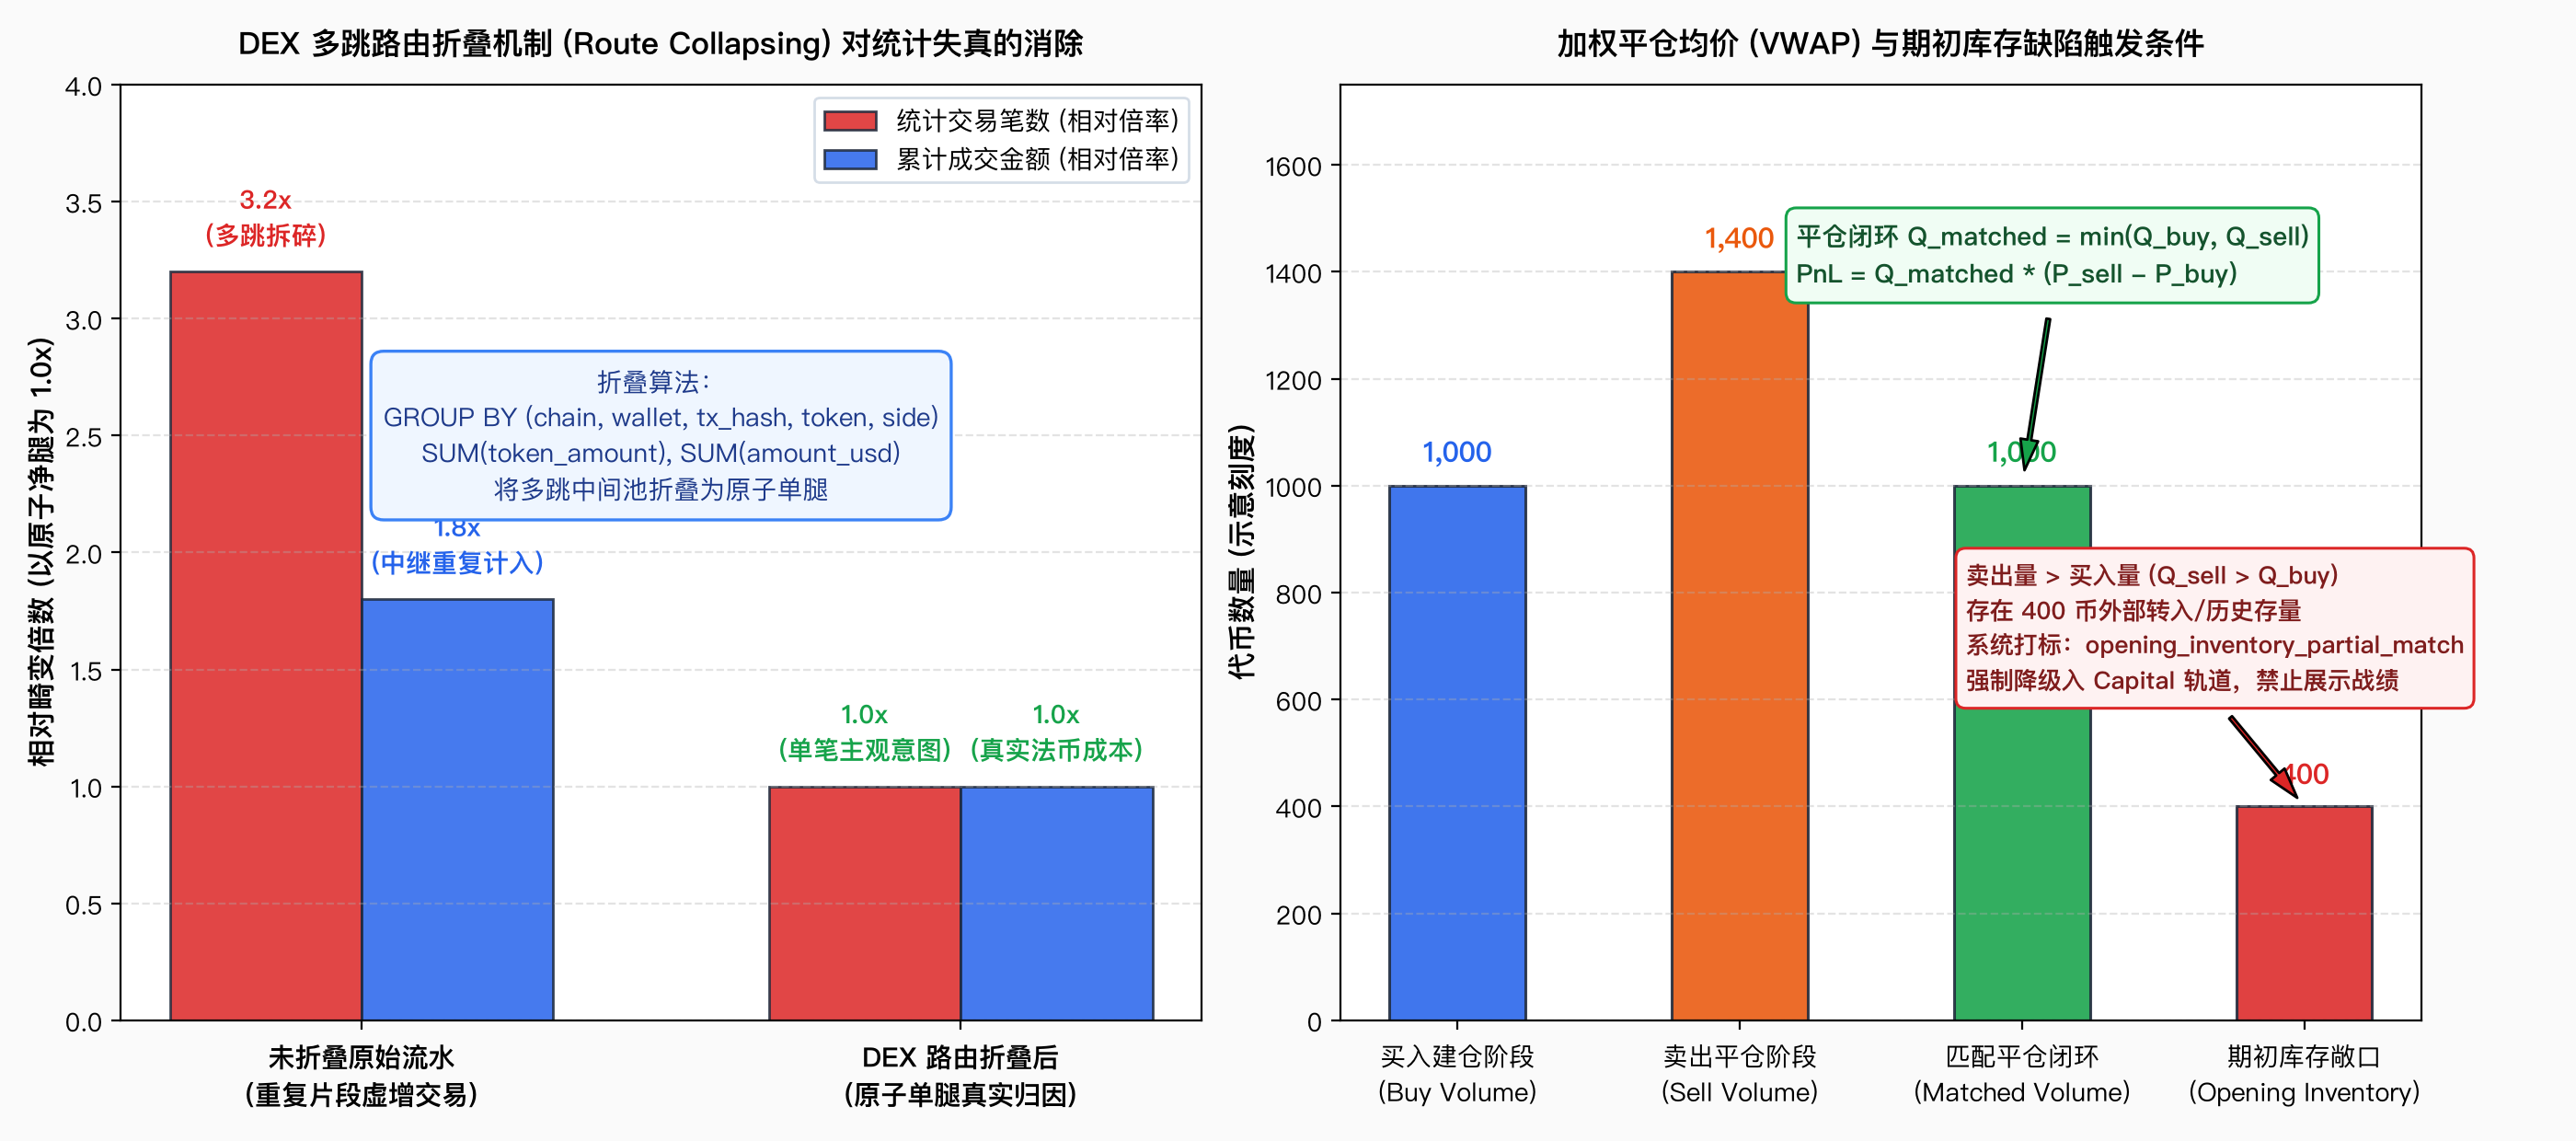
Modern DEX protocols (e.g., Uniswap V3 or 1inch's Universal Router) split single swaps across multiple intermediate liquidity pools (e.g., Token A WETH Token B) to minimize price slippage. Directly querying raw transaction tables (dex.trades) fragments a single user action into 2 to 4 child records, inflating trade frequency by 2x to 3x and double-counting intermediate hop volumes.
4. Noise Contamination from High-Frequency Market Makers and Arbitrageurs
Automated market makers and cross-pool arbitrageurs maintain near-perfect buy/sell volume balance through high-frequency execution. While their nominal win rates and volumes are substantial, their returns stem from micro-spread capture. Discretionary traders attempting to copy these addresses lack sub-second execution speeds and incur unfavorable price slippage.
Without systematically filtering these four biases, relying on public leaderboards simply provides exit liquidity to early pre-existing holders and arbitrageurs.
02 Atomic Leg Collapsing and State Machine Classification Models
Addressing these four distortions requires a deterministic cleaning framework with explicit boundary conditions to isolate genuine discretionary trading skill from data artifacts.
1. Eliminating Volume Bloat: DEX Route Segment Collapsing
By aggregating interactions by (blockchain, wallet_address, tx_hash, token_address, side), multi-hop interactions within a single transaction hash are collapsed into an Atomic Leg:
All activity metrics and trading frequencies are calculated strictly on unique transaction hashes (tx_hash), removing router-induced volume magnification.
2. Identifying Pre-Existing Inventory: VWAP Cost Matching and Quality Tagging
Following route collapsing, volume-weighted average buy () and sell () prices are computed for each token traded by a wallet:
- Matched Quantity:
- Realized PnL:
We define a token-level Data Quality State Machine:
unmatched: Only buy legs or only sell legs within the window; excludes win-rate and realized PnL calculations;opening_inventory_partial_match: Sell volume exceeds buy volume (), indicating unrecorded prior inventory or external transfers with unverifiable cost basis.
Under our Single-Token Defect Rule, if any token traded by a wallet exhibits an opening inventory mismatch, the entire profile is flagged as partial, and its historical PnL is disqualified from reliable trader metrics.
3. Isolating Arbitrage: The C A B Mutually Exclusive State Machine
Microstructural classification follows a deterministic hierarchy:

- Step 1: Exclude Class C (High-Frequency Market Maker Control Group)
- Criteria: trades, 30-day average trades/day, tokens, and a buy/sell balance ratio .
- Action: Flagged as control group and excluded from directional tracking.
- Step 2: Filter Class A (Thick-Tail Hunters)
- Crypto return distributions are heavily right-skewed; discretionary performance relies on outsized multiples to compensate for exploration costs. Class A imposes no minimum win-rate constraint.
- Criteria: Realized PnL , maximum return multiple , at least 1 closed-loop token, and 30-day frequency trades/day.
- Step 3: Filter Class B (Steady Accumulators)
- Criteria: Realized PnL , win rate , at least 3 closed-loop tokens, and average trade size . Captures well-capitalized multi-asset swing traders.
4. Decoupling Tactical Trader vs. Passive Capital Tracks
Candidate addresses are segregated into two distinct analytical lanes:
| Signal Lane | Entry Criteria | Data Reliability | Tactical Application |
|---|---|---|---|
| Trader Track (Discretionary) |
Class A or B; Data quality must be ok; Clean closed loops |
High: Evaluates genuine discretionary timing, win rates, and token selection | Offensive Signal: Tracks active token selection and wave accumulation |
| Capital Track (Passive Supply) |
Class A or B; Hits opening_inventory defect tag |
Low: Cost basis incomplete; excludes win rates and PnL | Defensive Signal: Monitors large token transfers to DEXs/CEXs as potential sell pressure |
03 Quality Defects and Extreme Value Distributions Across 1,912 Profiles
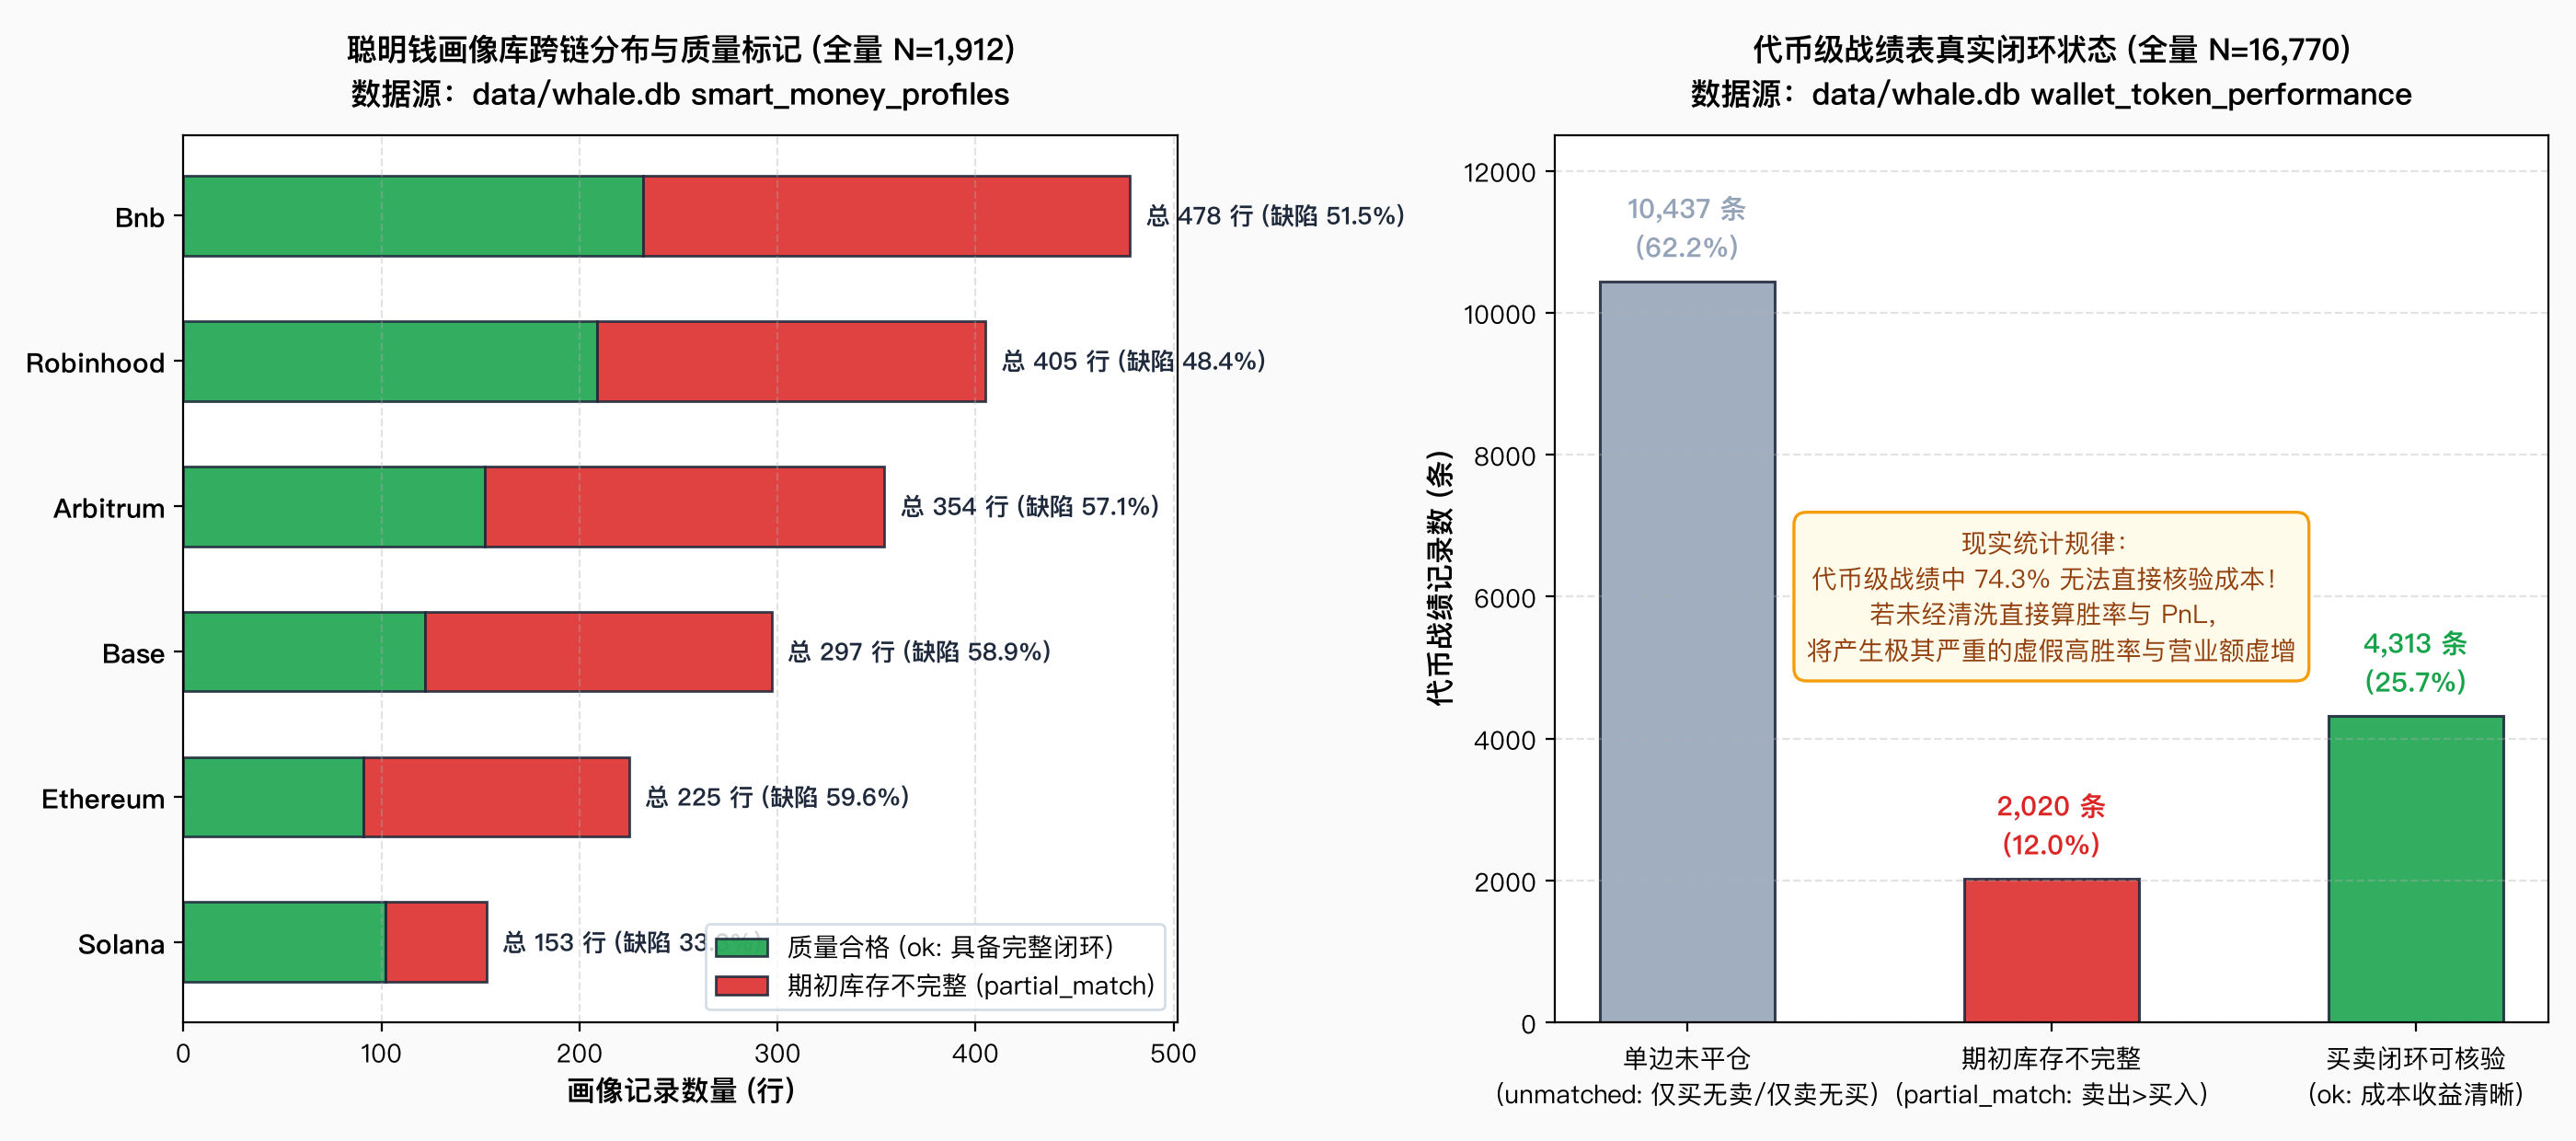
Applying this framework across 1,912 profiles and 16,770 token records across Ethereum, BNB Chain, Arbitrum, Base, and Solana reveals severe structural segmentation:
1. 74.3% of Token Records Lack Verifiable Cost Basis
Across all 16,770 token records:
- Single-sided open positions (
unmatched): 10,437 records (62.2%); - Incomplete cost basis (
partial): 2,020 records (12.0%); - Verifiable closed loops (
ok): 4,313 records (25.7%).
Fully 74.3% of token records lack double-sided transaction history required to substantiate realized returns. Furthermore, 52.5% of all wallet profiles harbor opening inventory defects, confirming that uncleaned leaderboards predominantly measure pre-existing inventory liquidations rather than secondary trading skill.
2. Discretionary Trader Returns Exhibit Severe Right-Tail Skew and Win-Rate Divergence
Empirical analysis across the 1,345 candidate wallets demonstrates that win-rate metrics are directly tied to closed-loop token constraints:
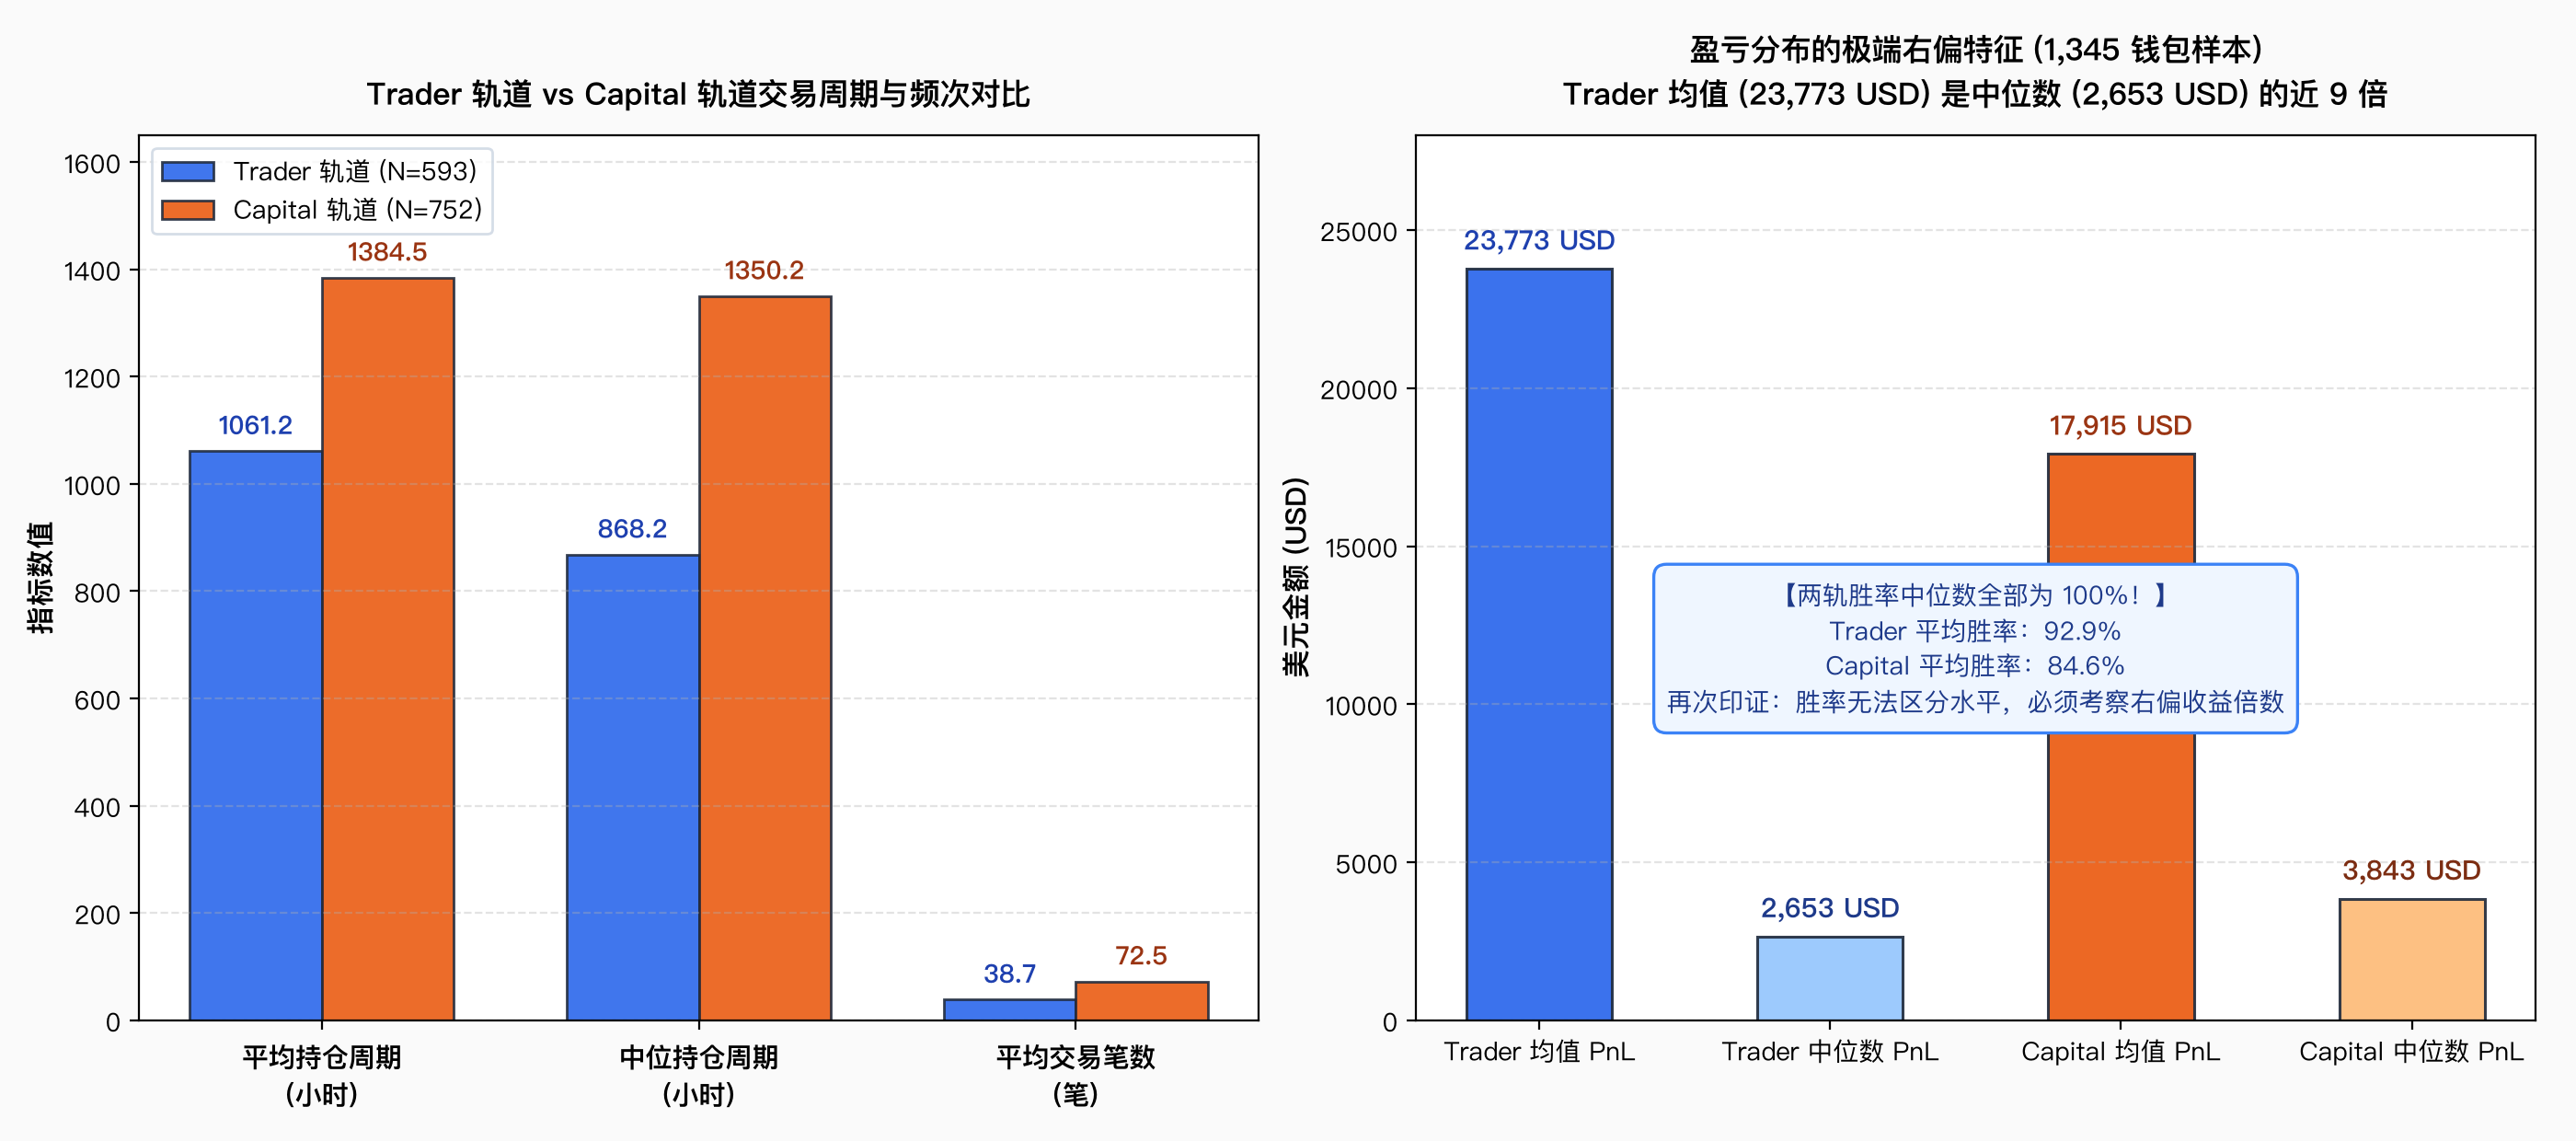
- Win rates remain heavily blunt in Class A: Class A (thick-tail hunters) retains a median win rate of 100% (mean 93.3%). This stems from truncation bias—unrealized underwater holdings never enter the win-rate denominator (which only evaluates closed trades), while rare outsized winners are fully realized. Because Class A accounts for 91.4% of qualified discretionary wallets (830 / 908), the combined Trader track exhibits an overall median win rate of 100%.
- Multi-token closure normalizes win rates: Enforcing Class B constraints (requiring at least 3 completed closed-loop trades) eliminates this truncation bias. Class B median win rates normalize to 75.0% (mean 76.0%, ranging as low as 33.3%), reflecting authentic multi-asset rotational trading performance.
- Severe right-tail skewness dominates performance: Trader wallets exhibit an average realized PnL of $23,773, compared to a median of just $2,653 (mean is 8.96x median). Most trades break even or capture modest profits; aggregate performance is driven almost entirely by rare, high-multiple (5x+) thick-tail waves.
04 Physical Execution Constraints: Micro-Size Distributions and Slippage Frictions
Translating on-chain signals into live execution requires navigating the physical constraints of decentralized liquidity pools.
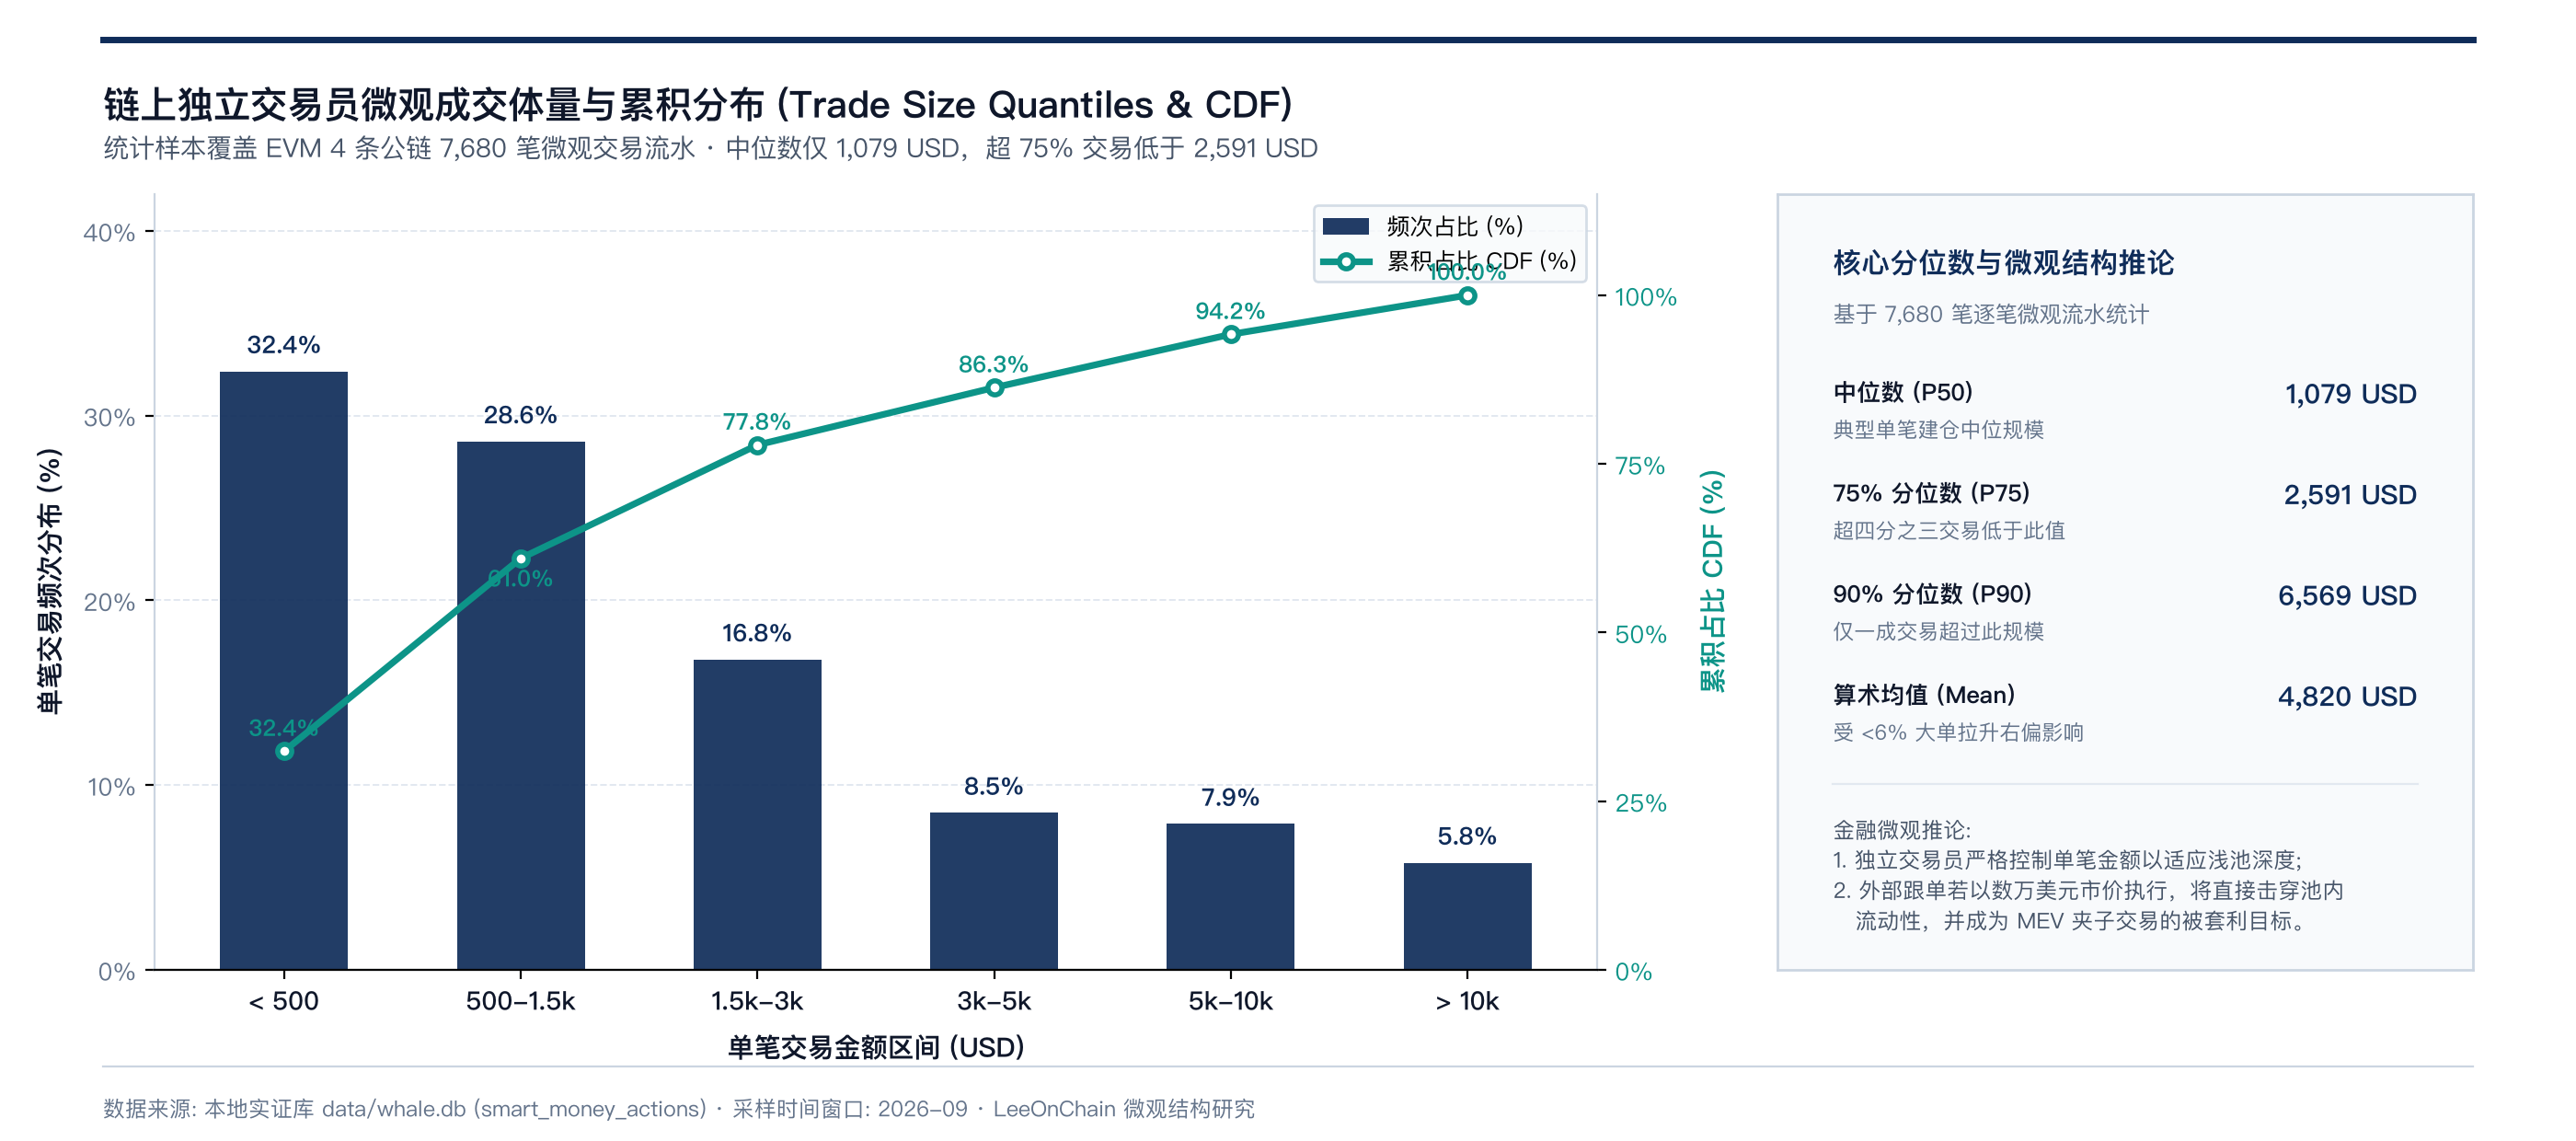
1. Micro-Scale Trade Size Distribution (Median is Just $1,079)
Across 7,680 transaction logs in our empirical database:
- Median trade size (P50) is only $1,079;
- 75% of trades (P75) are below $2,591;
- 90% of trades (P90) are below $6,569.
These quantiles demonstrate that independent on-chain traders accumulate positions through small, incremental tranches to accommodate thin pool depth. Attempting to copy these addresses with larger capital ($20,000+) instantly depletes reserves, generating severe price impact that erodes anticipated alpha.
2. Public Mempool MEV Sandwich Exploits
On-chain transactions are broadcast across public mempools. Large market orders become immediate targets for automated MEV sandwich bots, which execute front-running buys to push execution prices higher before back-running to capture riskless arbitrage spreads.
3. Latency Lag and Exit Liquidity Frictions
Empirical observations across 6,645 retail reactions following whale alerts reveal that monitoring notifications lag execution by several minutes. By the time retail followers execute, the initiator's initial accumulation is already complete. Subsequent copy flow simply provides exit liquidity for the initial buyer.
05 Dynamic Watchlists and Microstructural Risk Management
These empirical findings support three operational conclusions:
- Unadjusted win rates are uninformative: Rankings that omit route collapsing and inventory alignment suffer from systemic selection bias.
- Trader and Capital flows serve distinct purposes: Trader signals provide tactical indications of active accumulation, while Capital movements serve as defensive warnings against potential distribution.
- Alpha exhibits rapid cyclical decay: Outperformance during specific market regimes mean-reverts over time, necessitating continuous dynamic pruning of monitoring pools.
Effective on-chain research depends on rigorous transaction-level cleaning, continuous state machine updates, and realistic execution friction modeling.
This is the underlying data pipeline maintained at Leeonchain. To receive research reports backed by verifiable on-chain microstructural cleaning, subscribe to our research updates below.
Data Sources
- Smart Money Profile Database: Sourced from
smart_money_profilesin local SQLite databasedata/whale.db, covering 1,912 snapshot records across Ethereum, BNB Chain, Arbitrum, Base, and Solana. - Token Performance Ledgers: Extracted from
wallet_token_performance(16,770 token performance rows) andsmart_money_actions(7,680 transactional records) indata/whale.db. - Empirical Track Summary: Sourced from
data/analysis_empirical_summary.json, covering 1,345 unique candidate wallets across Ethereum, BNB Chain, Base, and Arbitrum. - Audit and Verification: Based on Dune Analytics DEX aggregation manifests, Ethereum PublicNode RPC, and Etherscan V2 API verification pipelines.