Across social media and messaging channels, automated alert bots frequently push breathless updates: "Smart money wallet with 100% win-rate just bought $50,000 of Token X."
Confronted with such alerts, traders often swing between two extremes: either blindly copying the trade—only to buy the local top and exit liquidity for insider wallets—or considering institutional analytics subscriptions costing $49 to $69 per month, which strain retail budgets and focus on macro overviews rather than fast, tactical screening.
Auditing candidate smart money profiles reveals that static leaderboard rankings fail to measure genuine trading skill. Conducting effective on-chain due diligence does not require expensive software: chaining together GMGN, Bubblemaps, Arkham, DeBank, and block explorers with a concise RPC script establishes a robust 10-minute investigation loop that mitigates copy-trading risks and eliminates noise.
01 Why Static "Smart Money" Leaderboards Fail
The objective of tracking smart money is identifying wallets with sustainable informational or execution edges. In practice, blindly copying public leaderboards consistently produces steep drawdowns due to three structural issues:
1. Win-Rate Saturation and Mean Reversion
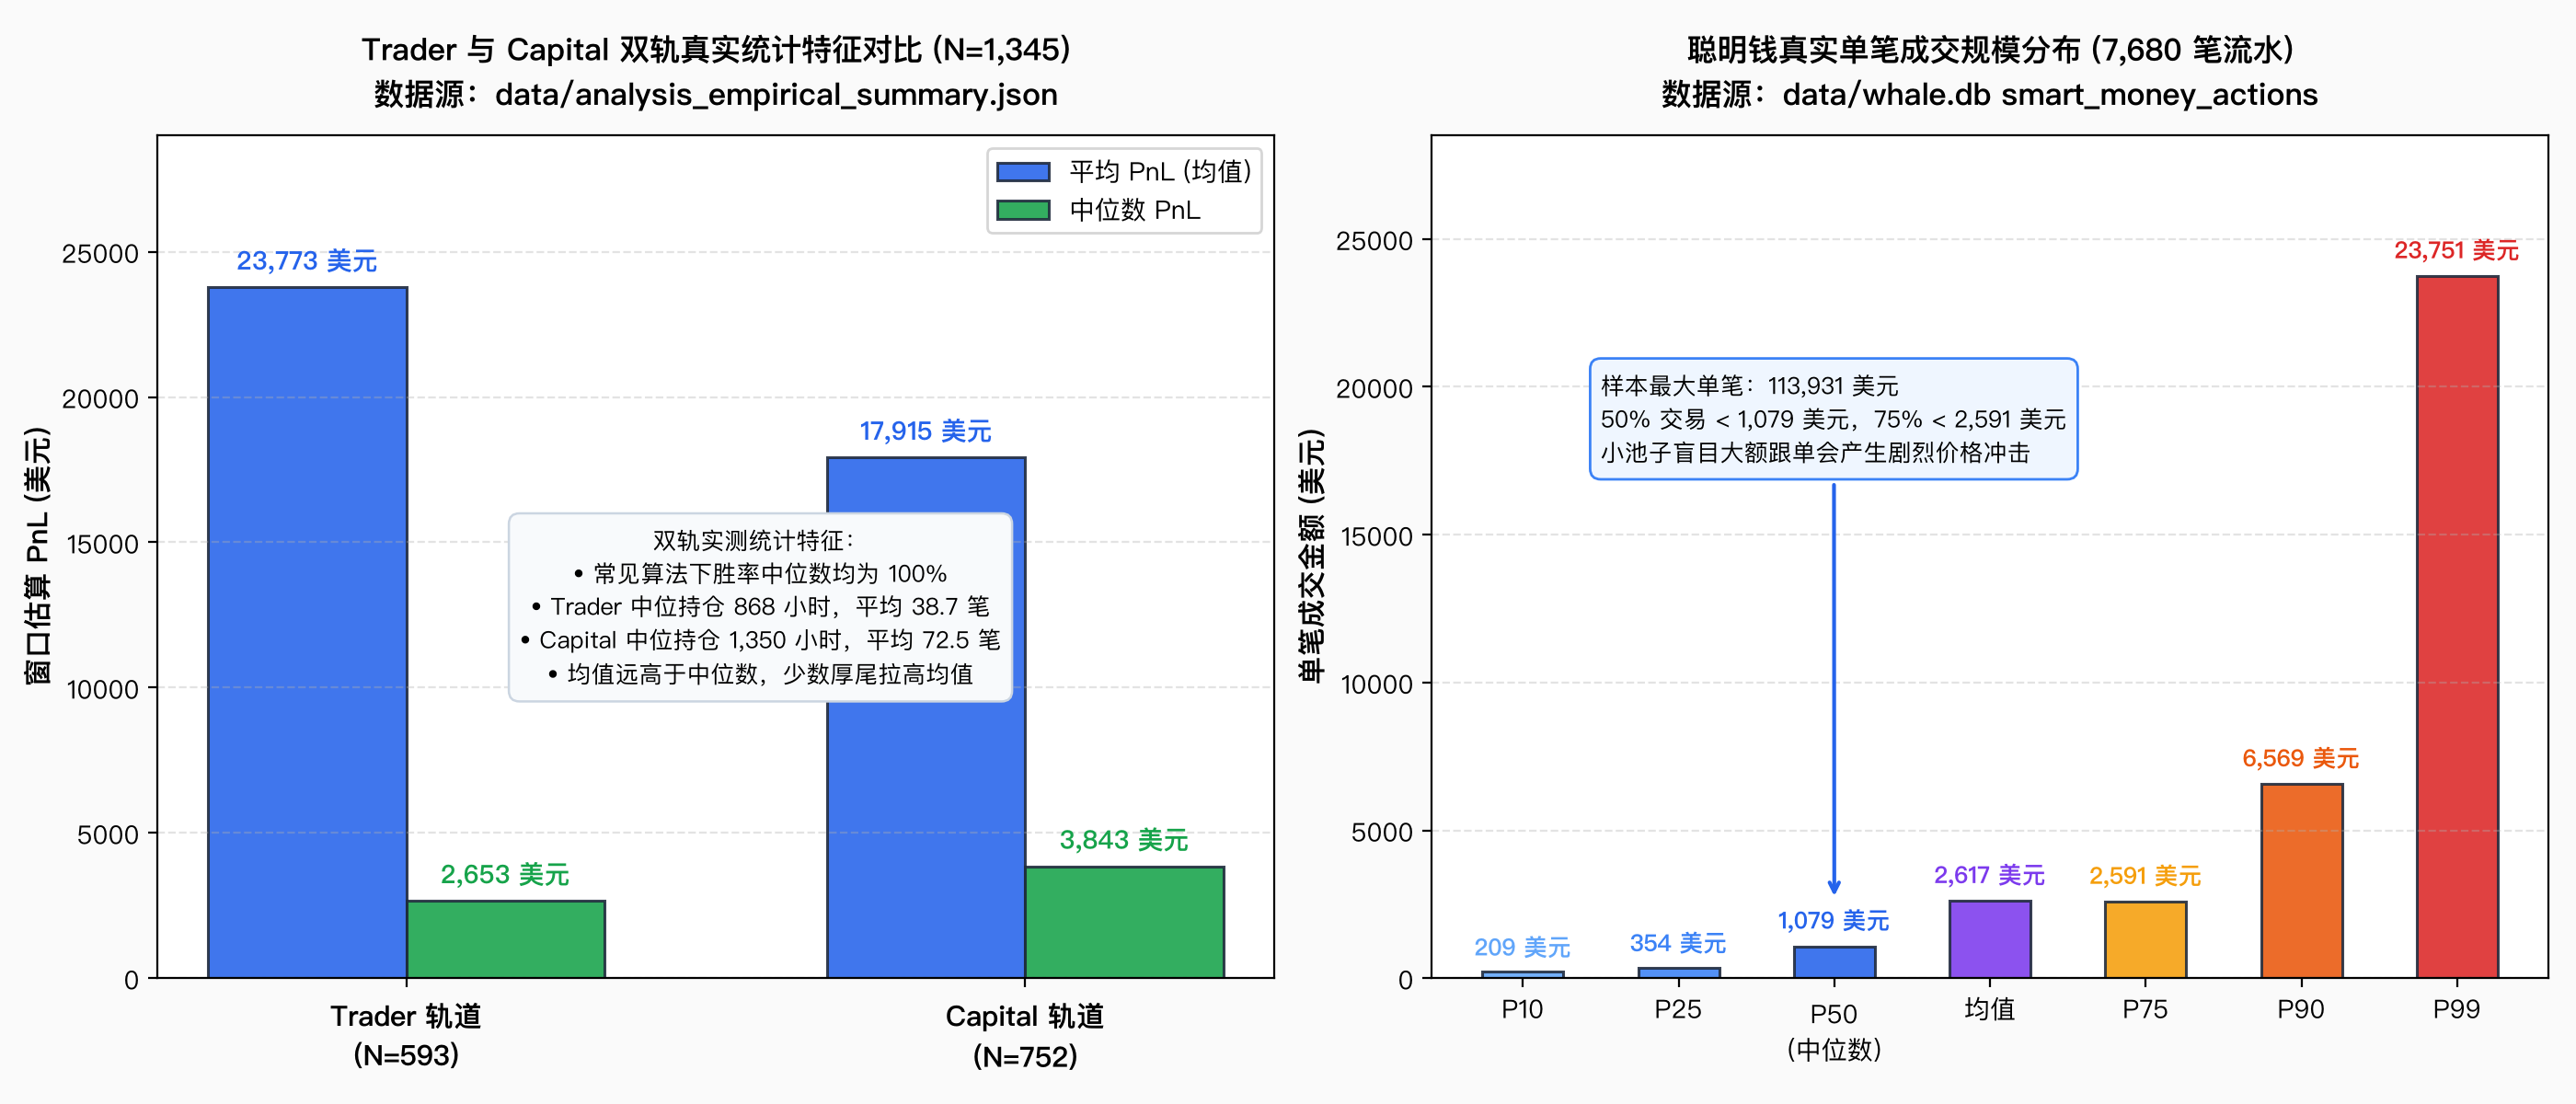
Across a sample of 1,345 candidate wallets evaluated via common leaderboard algorithms, the median win-rate stood at 100%. Wallets that sell only winning positions while holding losing tokens indefinitely, or accounts with only two or three lifetime trades, are mechanically classified as "flawless." Static win rates cannot differentiate trading skill from single-token survivorship bias.
Specialized platforms like Nansen maintain a dedicated Former Smart Trader classification. Wallets generating outsized returns during specific narrative rotations frequently suffer severe performance decay once market conditions shift, with win rates and profit factors mean-reverting rapidly.
Empirical data from the open-source backtesting project orvynel/crucible shows that blindly copying public smart money leaderboards generated a 30-day win rate of just 54%, underperforming simple buy-and-hold benchmarks.
2. Phantom Profits and Unaligned Opening Inventories
Among 1,912 smart money profiles audited, 1,004 (52.5%) carried opening_inventory_partial_match quality flags. Across 16,770 single-token performance records, only 25.7% featured complete within-window round-trip buys and sells; the remaining 74.3% suffered from one-sided trades or missing acquisition costs. Between 45% and 70% of high-PnL wallets exhibited flawed cost accounting.
Many addresses acquired tokens at near-zero cost prior to the monitoring window, or received tokens via batch transfers from external wallets, subsequently dumping them on DEXs within the window. Standard algorithms assume missing historical costs are zero or estimate them at prevailing day averages, misinterpreting gross selling turnover as "pure profit." Retail traders entering on these inflated track records are merely absorbing pre-existing token distributions.
3. Tool Fragmentation and Practical Gaps
| Tool Category | Example | Core Strength | Retail Investigation Limitation |
|---|---|---|---|
| Institutional Research | Nansen | Macro capital flows, backtested win rates, deep entity tags | Pro plan at $49–$69/month; coarse granularity for new tokens and micro-swaps |
| Execution Terminal | GMGN | Real-time orderflow, volume velocity, fast UX | Platform labels skew short-term speculative; built-in swaps incur 0.5%–1% fees |
| Holder Topology | Bubblemaps | Bubble cluster visualization, insider wallet mapping | Focuses on token distribution; lacks individual wallet PnL breakdowns |
| Entity Attribution | Arkham | Extensive label database, counterparty visualizer | Primarily English UI; limited coverage for emerging non-EVM chains |
| Portfolio Dashboard | DeBank | Clean multi-chain balance aggregation, position history | Lacks quantitative win-rate metrics; cannot detect coordinated bundle snipes |
02 The Four-Step Investigation Workflow
To identify deceptive transactions and filter market-maker churn within minutes, we deploy an inside-out four-step workflow:
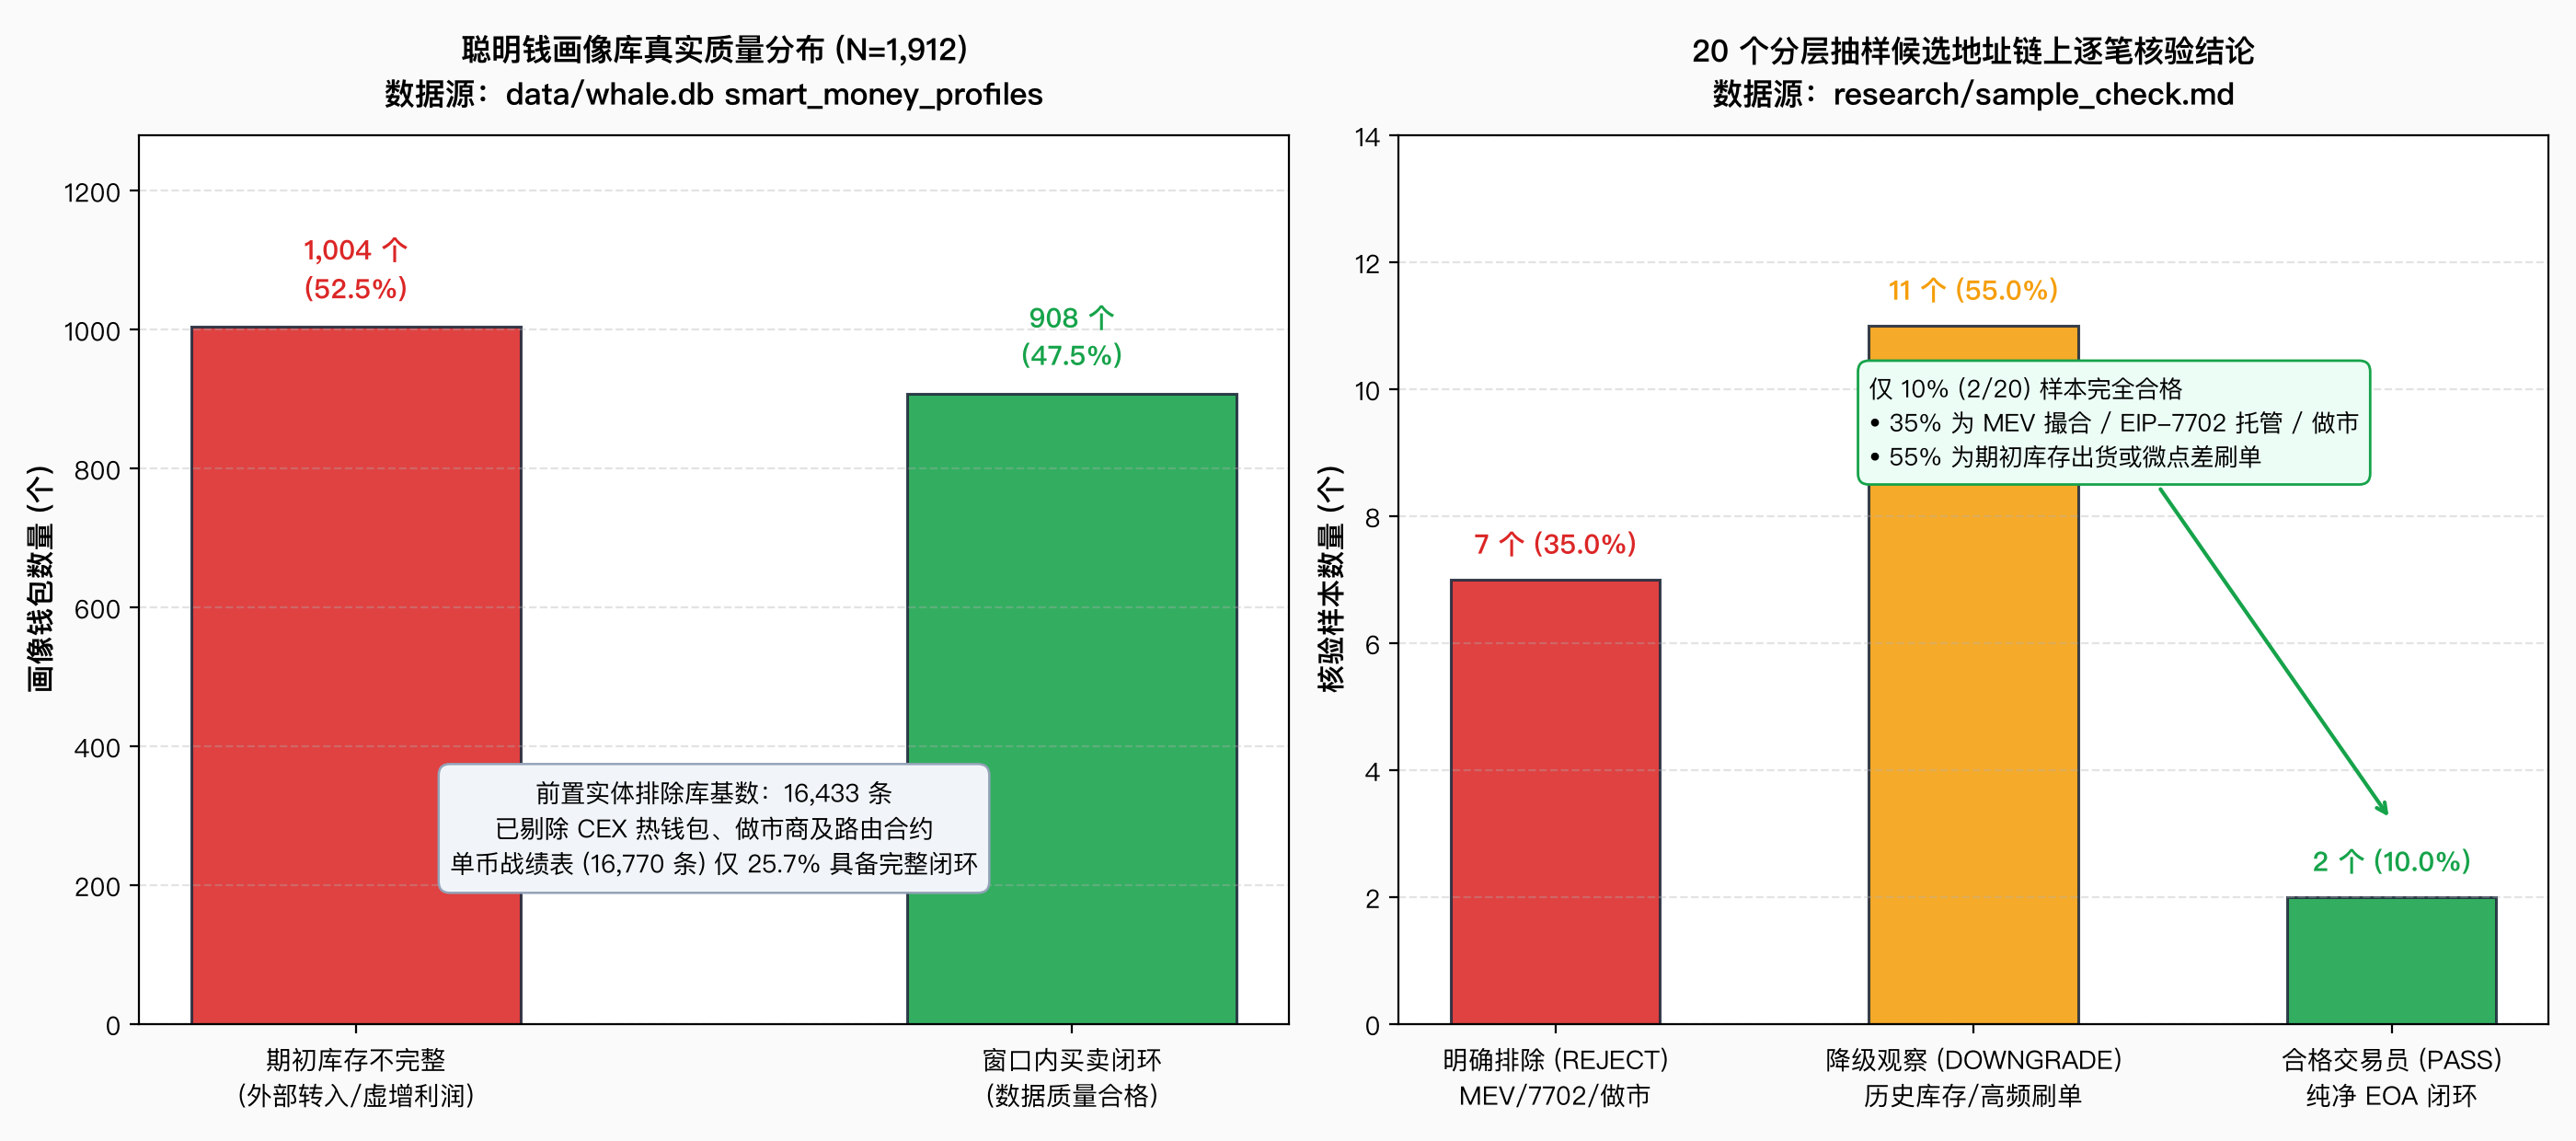
The chart above illustrates the real filtering bottleneck: over half of all candidate profiles suffer from opening inventory defects. In our granular on-chain audit of 20 stratified sample addresses, genuine independent traders accounted for just 10.0% (2 verified PASS, 11 downgraded due to inventory flaws or micro-spread churn, and 7 outright disqualified for MEV routing, EIP-7702 delegation, or high-frequency market making).
Step 1: Signal Discovery and Orderflow Screening (GMGN)
Upon receiving an alert or obtaining a token contract address (CA), the first priority is verifying core contract safety and pool liquidity:
- Mint and Freeze Authority: Confirm whether the deployer renounced mint and freeze capabilities. Retained minting or blacklist permissions represent high-risk attack vectors.
- Buy and Sell Taxes: Verify that trading taxes are 0%. Taxes exceeding 5%—or approaching 100%—indicate malicious honeypots.
- Liquidity Depth and Lock Status: Check the LP pool size. A $5,000 pool backing a $5M market cap will experience severe price impact on modest orders. Ensure LP tokens are permanently burned to dead addresses or time-locked via verifiable escrow.
Next, inspect the 5-minute trade stream. If buy orders display identical amounts (e.g., repeating 0.1 SOL) spaced evenly every few seconds, automated scripts are manufacturing artificial activity. Filter out micro-trades under $100 and evaluate the proportion of genuine orders exceeding $1,000.
Step 2: Holder Distribution and Cluster Analysis (Bubblemaps)
Following basic safety clearance, step two evaluates historical token distribution to ensure the dev team has not disguised insider holdings across dozens of puppet wallets:
Open Bubblemaps, select the relevant blockchain, and inspect the top 20 holder bubble topology:
- Independent Bubbles (Healthy): Wallets appear separated with uniform bubble sizes and zero interconnecting transfer lines. Outside official DEX pools or vesting contracts, the top 10 holders combined should control under 20% of supply, with individual wallets holding under 2%–3%.
- Clustered Nodes (High Risk): Multiple bubbles connected by transfer lines indicate direct on-chain fund flows. Clicking the cluster reveals its aggregate supply share.
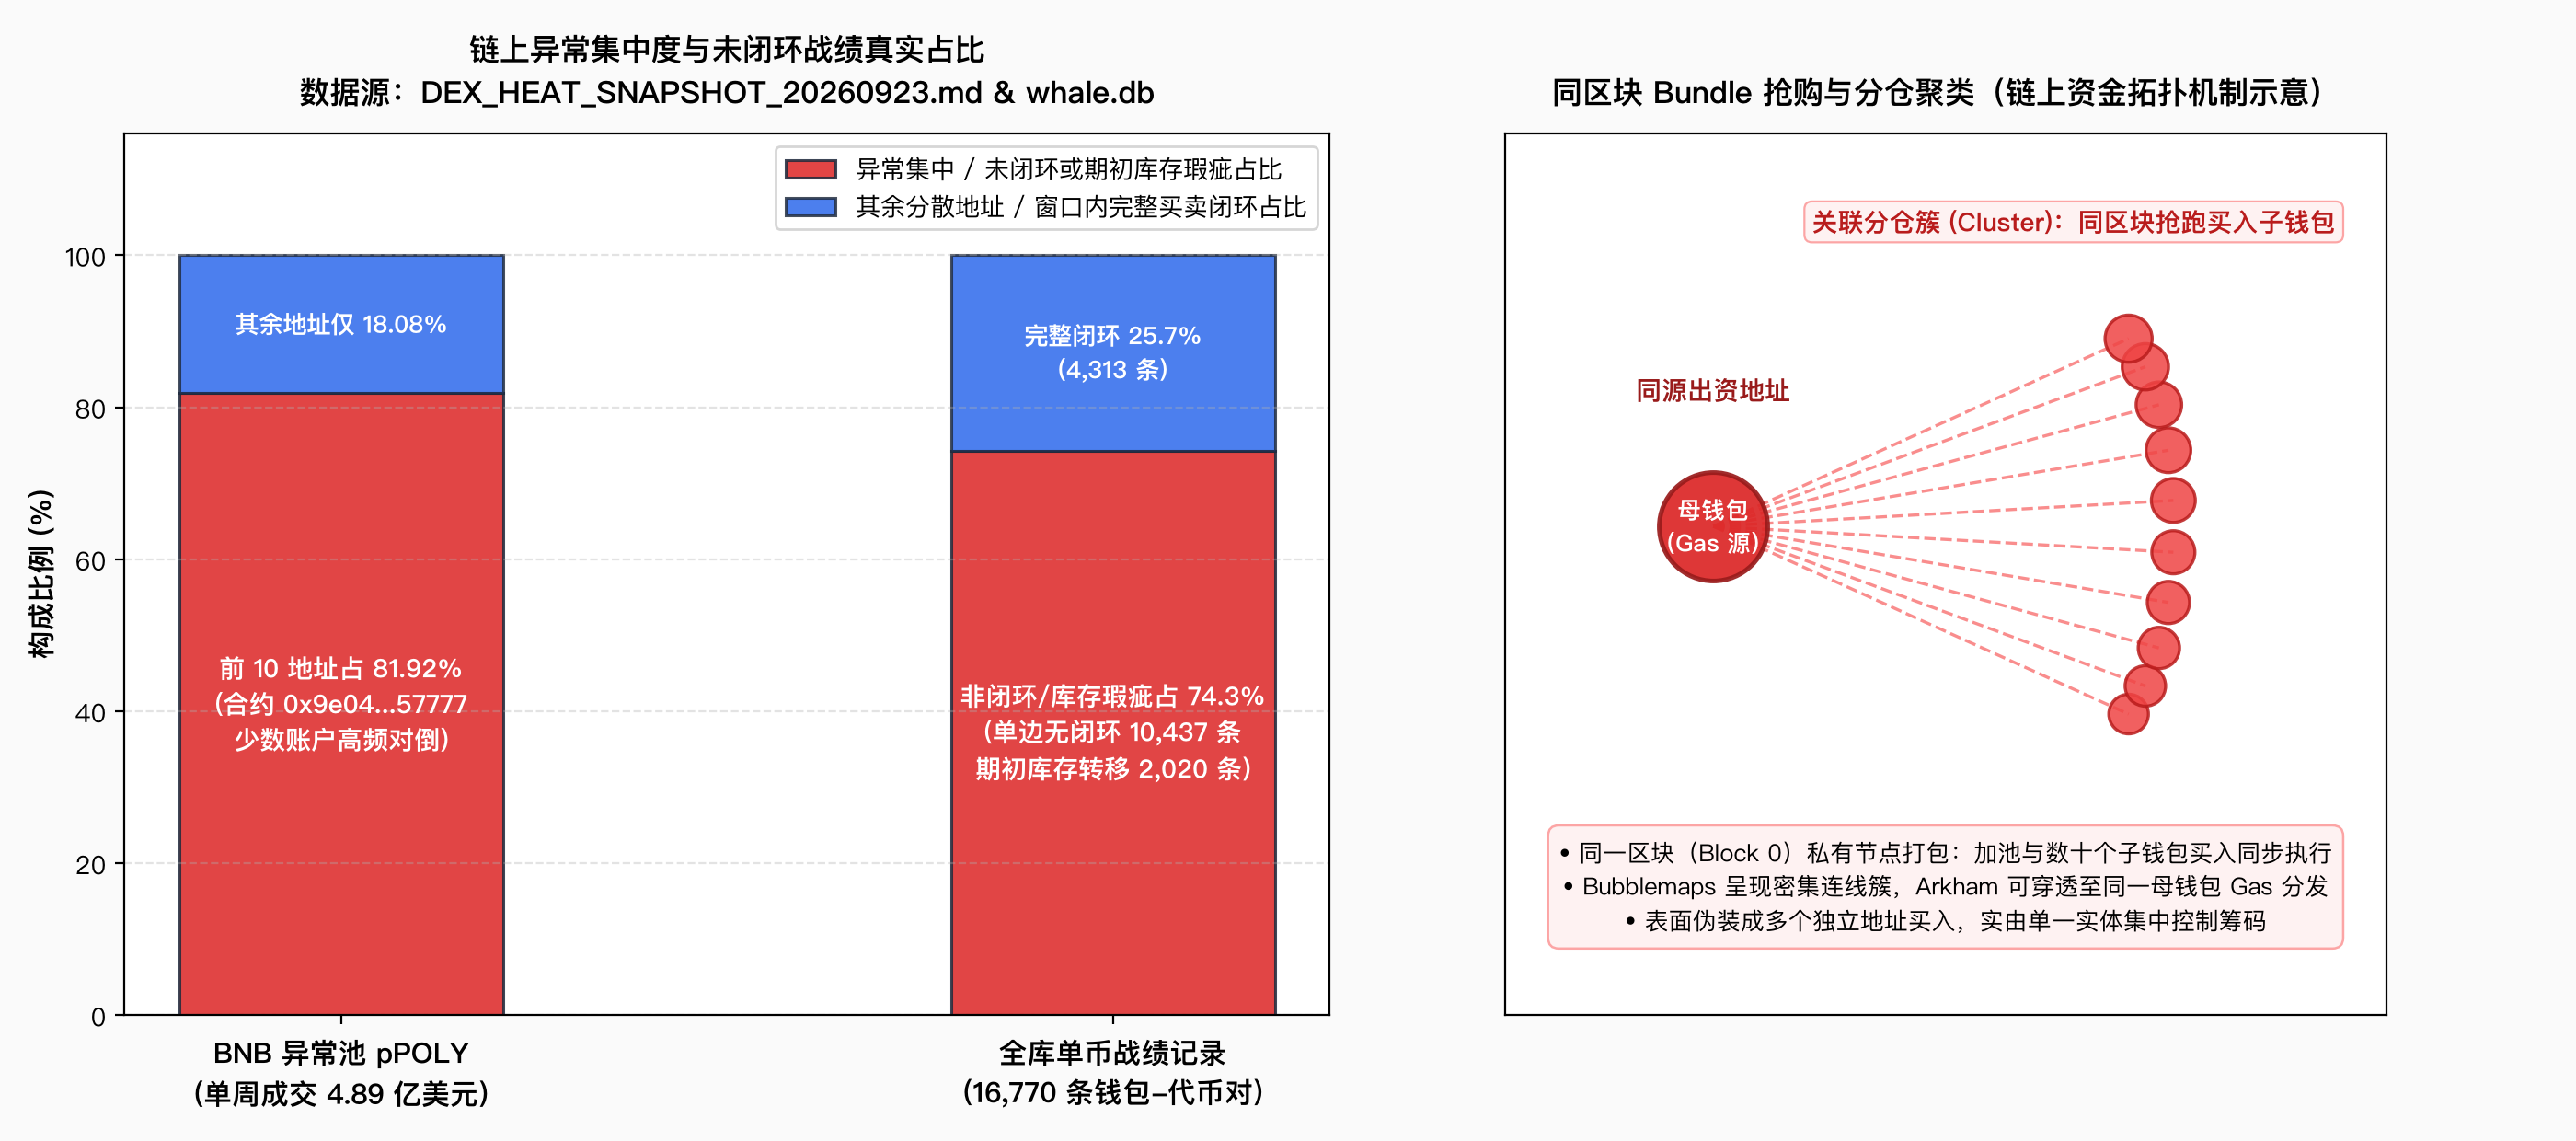
As shown in the empirical data above (left), BNB Chain's pPOLY pool (0x9e0494c6b45955c6f97f485184206772a2f57777) logged $489M in weekly volume, yet the top 10 addresses generated 81.92% of all trading through circular wash-trading.
As illustrated on the right, many token launches utilize private transaction bundles (such as Jito on Solana or Flashbots on Ethereum) to package initial liquidity addition and multiple sub-wallet snipes inside Block 0. These insider wallets acquire the bulk of supply before public broadcast, dispersing tokens across puppet accounts. When retail copy-traders enter on momentum, these clusters dump into incoming liquidity. If the top 10 holders control over 30% through connected clusters, abandon the trade immediately.
Step 3: Capital Provenance and Entity Attribution (Arkham)
If token distribution appears dispersed, the next step involves attributing the specific triggering wallet to separate independent traders from institutional market makers:
Paste the address into Arkham to verify three dimensions:
- Entity Attribution: Check automated entity tags. Addresses tagged to market makers (Wintermute, Jump Trading, Amber Group) or CEX deposit infrastructure represent delta-neutral inventory rebalancing rather than directional alpha.
- Gas and Initial Funding Provenance: Track the wallet's genesis transaction. Inflows from Binance, OKX, or Coinbase hot wallets indicate individual or independent capital. Funding from an untagged EOA that simultaneously distributed equal micro-amounts to 50 fresh wallets signals a coordinated sybil matrix.
- Counterparty Visualizer: Open the Visualizer graph to observe whether the address interacts primarily with retail DEX routers or complex lending, bridge, and private pool contracts.
Step 4: Automated Verification Script and Dual-Track Allocation
Manual browser checks can become cumbersome. For programmatic screening, lightweight RPC calls (eth_getCode) combined with Etherscan API endpoints automate the process.
Below is the core Node.js script used to audit sample addresses, filtering contracts, EIP-7702 delegations, MEV bots, and missing inventory baselines:
// Automated on-chain wallet verification script
const { execSync } = require('child_process');

function rpcCall(rpcUrl, method, params) {
  const payload = JSON.stringify({ jsonrpc: '2.0', method, params, id: 1 });
  const raw = execSync(`curl -s -m 10 -X POST "${rpcUrl}" -H "Content-Type: application/json" -d '${payload}'`);
  return JSON.parse(raw.toString());
}

function verifyWalletAccount(address, rpcUrl, etherscanKey) {
  // 1. Inspect bytecode: filter contracts and EIP-7702 delegations
  const codeRes = rpcCall(rpcUrl, 'eth_getCode', [address, 'latest']);
  const code = codeRes.result || '0x';
  if (code !== '0x') {
    if (code.startsWith('0xef0100')) {
      return { pass: false, reason: 'EIP-7702 delegated smart contract account' };
    }
    return { pass: false, reason: 'Smart contract address (non-EOA)' };
  }

  // 2. Scan transaction history: identify MEV and private routing signatures
  const txListUrl = `https://api.etherscan.io/v2/api?chainid=1&apikey=${etherscanKey}&module=account&action=txlist&address=${address}&sort=desc&page=1&offset=25`;
  const txData = JSON.parse(execSync(`curl -s -m 10 "${txListUrl}"`).toString());
  const hasMevMethod = (txData.result || []).some(tx => {
    const fn = (tx.functionName || '').toLowerCase();
    return fn.includes('fillorder') || fn.includes('nothingtoseehere') || fn.includes('sandwich');
  });
  if (hasMevMethod) {
    return { pass: false, reason: 'MEV arbitrage / private order routing bot' };
  }

  // 3. Round-trip trade matching: ensure sold tokens were acquired via DEX in-window
  const tokenTxUrl = `https://api.etherscan.io/v2/api?chainid=1&apikey=${etherscanKey}&module=account&action=tokentx&address=${address}&sort=desc&page=1&offset=100`;
  const tokenData = JSON.parse(execSync(`curl -s -m 10 "${tokenTxUrl}"`).toString());
  const tokenTxs = tokenData.result || [];

  const incomingBuys = tokenTxs.filter(tx => tx.to.toLowerCase() === address.toLowerCase());
  const outgoingSells = tokenTxs.filter(tx => tx.from.toLowerCase() === address.toLowerCase());
  if (outgoingSells.length > 0 && incomingBuys.length === 0) {
    return { pass: false, reason: 'Historical inventory liquidation (missing acquisition in window)' };
  }

  return { pass: true, reason: 'Verified independent EOA' };
}
Wallets that pass the script and manual checks can be categorized into two distinct monitoring tracks on DeBank:
- Trader Track (Agile Independent Operators): Trade sizes between $1,000 and $20,000, spot DEX executions, with active profit-taking and stop-loss records. These wallets offer tactical signal value.
- Capital Track (Treasuries / Large Allocators): Balances exceeding $1M, engaged primarily in staking, lending collateral, and cross-chain bridging. Not suitable for short-term copy-trading, but large transfers into CEX hot wallets provide early warnings of macro sell pressure.
03 Case Studies: Two Disqualifications and Two Verified Traders
Below are real-world audits drawn from empirical on-chain sample evaluations.
Case A (Disqualified): MEV Searcher and EIP-7702 Custodial Account Masked as "100% Win-Rate Swing Traders"
Sample 1: 0xaaaaa34e4bb04f1c5f5a56d3be9e7637d309bc05
Displayed only 13 transactions with a 100% win rate and $15,839 in estimated profit on PEPE and SHIB, superficially matching the profile of a patient swing trader.
Investigation:
- The address displays vanity syntax (
0xaaaa...), typically generated by mining scripts. - In Arkham and Etherscan, key transaction
0xeb10f65edb0564cd1167f1f37fdff76b472096f5abf076f1f2f22c56032161c5shows direct interaction with contract0x00000000008d5f1200332af8a6813cb8377b5bfdcallingnothingToSeeHere_04ikDO9()andfillOrderArgs. - The wallet is an MEV searcher executing private orderflow settlements. Profits derived from atomic arbitrage spread residuals rather than directional trades, rendering the strategy unreplicable for retail traders.
Sample 2: 0x630ece5a8c9da9dfa272cf10c54fecd2c8cd5101
Logged 2 trades, 100% win rate, and $2,620 in estimated profit.
Investigation:
- RPC query
eth_getCodereturned0xef01007702cb554e6bfb442cb743a7df23154544a7176c—the standard bytecode prefix for EIP-7702 smart contract account delegation under Ethereum's Pectra upgrade. - Key transaction
0xc4a77343e1be816425d2f6183c9a7f2eb49d7168096fb171e4261b131ef405eerouted through LiFi Diamond to sell PEPE for $9,826 USDC, but the underlying tokens were transferred from an external address in late 2024. Disqualified due to non-EOA programmatic execution and incomplete cost baselines.
Case B (Disqualified): Phantom PnL from Pre-Window Inventory and Wash Churn
Sample: 0xd9d8f818a7a71ed0e1fe936b991508b0e88b1609
Ranked top of the sample dataset with $23,409.84 in estimated profit across 269 trades.
Investigation:
- Inspecting key transaction
0x60801029c213ee33133a893151e60131ecc39024e7675f62bdf48856bf032ca9alongside fulltokentxhistories revealed that all PEPE sold in-window originated from pre-window transfers. - With zero in-window buy entries, standard average-cost calculations treated the entire $23k+ sales proceeds as pure net profit.
- Flagged with
opening_inventory_partial_matchand removed from candidate signals.
Similar structural noise occurs at institutional levels. As noted, BNB Chain's pPOLY logged $489M in weekly volume, yet 81.92% was churned among 10 addresses. Similarly, transfers from market-maker clusters like Wintermute (0x0000006daea1723962647b7e189d311d757fb793) represent inventory rebalancing across protocols; following these as directional buy signals causes retail traders to purchase local liquidity peaks.
Case C (Verified): Independent Traders Passing Four-Step Screening
Sample 1: 0x8d0982da5396cd420cd73f496d0d53577dbfb997
- Verification:
eth_getCodereturns0x(pure EOA). Zero MEV contract interactions. - Trade Lifecycle: In transaction
0xfa0593a89d16952d1cc53afaacc8233487e8ce300df75111157e6538b05d2d93, the wallet executed a standard Uniswap buy of PEPE and liquidated several weeks later for a realized gain of ~$2,100, matching calculated estimates. Classified as a verified low-frequency swing trader.
Sample 2: 0x3004892cf2946356e8e4570a94748afdff86681c
- Verification: Clean EOA actively trading mid-cap tokens.
- Trade Lifecycle: Key transaction
0x3338e62f96f57df71debcc4e9104c26e3f4cf447de1431186d7c707860083654. Historical transactions focus on mid-cap meme pairs (FLORK, GIGA, basedAI, APU, PEPE) with verified DEX accumulation and staged profit-taking. Retained for active tracking.
04 Physical Realities and Execution Friction in Copy-Trading
Even after isolating genuine traders, converting on-chain observations into actual returns remains bounded by execution mechanics:
1. Trade Size and Liquidity Depth Constraints
Across 7,680 verified smart money transactions, the size distribution reveals:
- P10: $209
- P25: $354
- P50 (Median): $1,079
- P75: $2,591
- Mean: $2,617
- P90: $6,569
- P99: $23,751
- Max: $113,931
Over 50% of smart money orders are under $1,079, and 75% are under $2,591. Experienced on-chain operators understand that thin token pools cannot absorb large size, making staged micro-orders essential.
If copy-traders deploy tens of thousands of dollars into thin liquidity pools, large market orders cause massive price slippage. Loosening slippage tolerances exposes orders to predatory MEV sandwich bots in the public mempool.
Trader SkepticLab documented this pitfall: while copy-trading small-cap tokens, paper gains reached 60% before reversing into a 60% loss within hours. The tracked wallet's small sell orders drained bid liquidity, turning the target's exit into the copy-trader's forced stop-out.
Similarly, an ainvest study of 6,645 whale transactions showed that retail traders reacting to public alerts enter seconds to minutes after the whale order fills, serving as liquidity for early accumulators.
2. Decoupling Trader and Capital Tracks
- Trader Track (Agile Operators): Median holding time of 868.2 hours (~36 days), average trade count 38.7, mean PnL $23,773 vs median PnL $2,653. The wide spread between mean and median highlights heavy reliance on rare outsized multi-baggers. Suitable for tactical tracking.
- Capital Track (Institutional Treasuries): Median holding period 1,350.2 hours (~56 days), average trade count 72.5, mean PnL $17,915, median PnL $3,843. Capital focuses on yield staking, collateral, and liquidity deployment.
Usage guidelines differ:
- Never copy-buy Capital wallets: Large funds tolerate 30%–50% drawdowns across multi-month accumulation horizons; retail traders get shaken out during consolidation.
- Treat Capital CEX deposits as risk alerts, not immediate sells: While deposits to exchanges often signal sell pressure, an analysis of 14 massive exchange inflows revealed that 12 were re-withdrawn within 12–48 hours to derivatives margin or staking contracts without spot liquidation. Always confirm secondary transfers to spot matching wallets before acting.
05 Tool Matrix and Functional Boundaries
Effective on-chain analysis does not rely on a single platform, but chains free tools across their respective specialties:
| Dimension | Nansen | GMGN | Bubblemaps | Arkham | DeBank | Explorer / RPC |
|---|---|---|---|---|---|---|
| Primary Strength | Institutional flows, research, win-rate metrics | Real-time orderflow, volume velocity, basic filters | Bubble cluster maps, sybil cluster visualization | Entity labels, counterparty network graph | Multi-chain balance tracking, position history | Bytecode audit (EIP-7702), round-trip lifecycle check |
| Chain Coverage | 20+ EVM, Solana | Solana, Base, ETH, emerging chains | EVM, Solana, Tron, major L1s | 15+ chains including Bitcoin | 30+ EVM, Solana | Universal across public RPCs and explorers |
| Core Advantage | Algorithmic labels with human review | Clean UI for checking tax and LP burns | Fast detection of Block 0 bundle snipes | Rapid identification of Wintermute and CEXs | Accurate portfolio tracking across DeFi | Deterministic bytecode verification |
| Cost | Pro $49–$69/month | Free charting; 0.5%–1% in-app swap fee | Free tier for basic clusters | Free personal search and graph queries | Completely free portfolio dashboard | Free public RPCs and Etherscan tier |
| Investigation Role | Macro benchmarking | Step 1: Orderflow & safety screening | Step 2: Cluster and bundle detection | Step 3: Entity attribution & provenance | Step 4: Watchlist portfolio tracking | Step 4: Code verification & audit |
Data Sources
- On-Chain Profiles and History: SQLite database
data/whale.dbcontaining 1,912 smart money profiles, 16,770 single-token performance records, 7,680 transaction logs, and 16,433 entity labels. - Stratified Sample Audit: Granular transaction analysis conducted on 20 stratified sample addresses via PublicNode Ethereum RPC (
eth_getCode) and Etherscan V2 API (tokentx,txlist). - Chain and DEX Volume Snapshots: Dune Analytics DEX queries collected September 23, 2026 (including BNB Chain
pPOLYpool0x9e0494c6b45955c6f97f485184206772a2f57777volume concentration). - External Empirical Studies:
orvynel/crucibleopen-source backtest (30-day smart money copy-trading win rate of 54%).- ainvest study on retail reactions across 6,645 whale transfers.
- Analysis of 14 exchange deposits and subsequent 12–48 hour outflows.
- SkepticLab retrospective on small-cap copy-trading liquidity collapse.