
Risk Disclaimer: The on-chain metrics, statistical models, and historical data referenced in this report are for research purposes only and do not constitute investment advice or trading recommendations. Past statistical distributions do not guarantee future performance.
When analyzing on-chain data, traders frequently conflate long-term macro indicators with the high-frequency operational metrics of individual blockchains. Some refresh MVRV or SOPR daily, discovering that these numbers barely budge over weeks, offering little actionable guidance for swing trades. Others obsess over daily DEX swap counts, comparing Solana's micro-transactions directly against Ethereum's high-value settlements, mistaking architectural throughput for genuine ecosystem acceleration.
Making sense of on-chain data requires untangling cyclical valuation metrics, liquidity derivatives, structural blockchain parameters, and marginal dynamic flows. Macro indicators map cyclical positioning, while daily chain metrics capture localized capital velocity.
01 Three Classic Cyclical Metrics and Flow Indicators
In on-chain macro research, MVRV, SOPR, and CDD serve as fundamental anchors for evaluating cycle valuation, aggregate cost basis, and dormant supply activation across major assets like Bitcoin. Combined with spot ETF net inflows and derivatives liquidation maps, they provide a complete lens into macro capital movement.
1. MVRV and MVRV Z-Score
MVRV (Market Value to Realized Value) measures the ratio between market capitalization and realized capitalization.
- Market Cap: The circulating coin supply multiplied by the current secondary market price.
- Realized Cap: The sum of each unspent transaction output (UTXO) valued at the market price when it was last moved on-chain. Realized Cap represents the volume-weighted aggregate acquisition cost of all holders.
When MVRV exceeds 1.0, the aggregate network sits on unrealized capital gains. When MVRV falls below 1.0, aggregate market valuation drops below the market's average cost basis, putting holders into net unrealized loss.
To normalize for expanding cyclical market size, analysts rely on the MVRV Z-Score, calculated as the spread between Market Cap and Realized Cap divided by the standard deviation of historical Market Cap :
- Z-Score > 5 to 7: Market Cap diverges drastically from Realized Cap, signaling peak cyclical unrealized profits—historically corresponding to macro bull tops.
- Z-Score < 0: Market Cap drops below total acquisition cost, reflecting capitulation and historically marking cyclical generational accumulation zones.
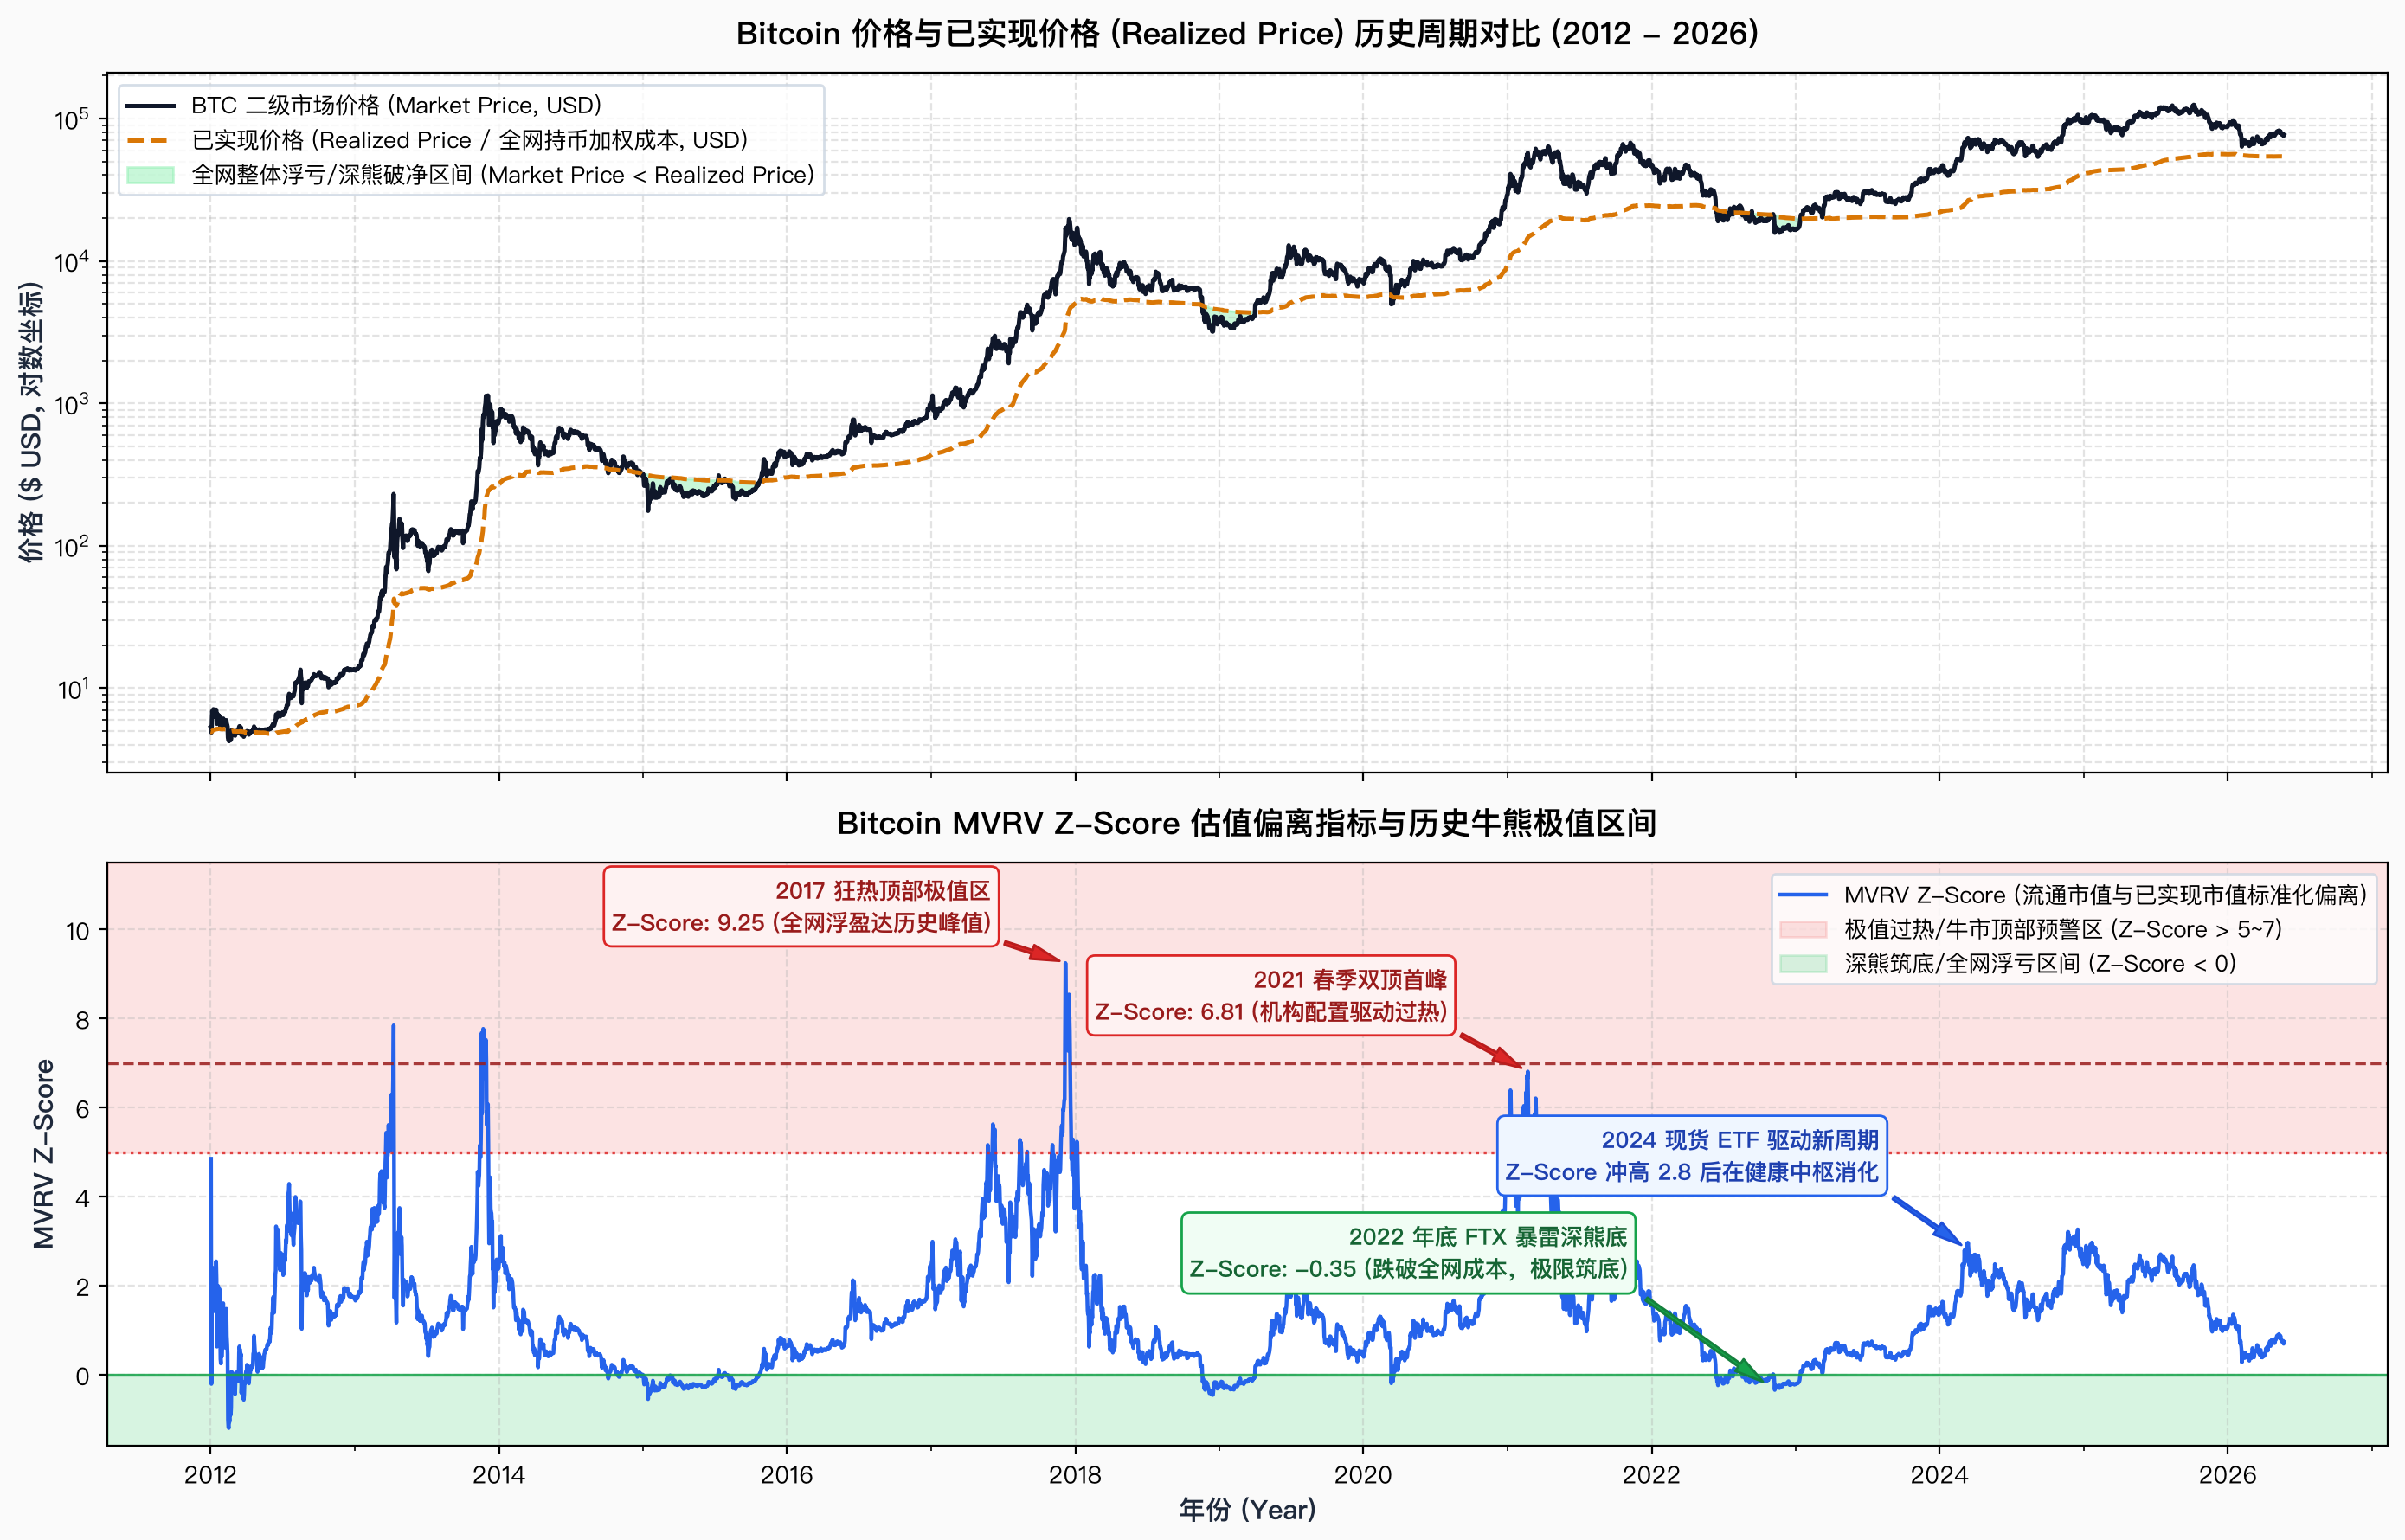
MVRV is a counter-trend macro anchor whose cycles span quarters or years. Because internal centralized exchange (CEX) ledger turnovers do not manifest as on-chain transactions, MVRV cannot guide intraday or weekly executions.
2. ETH MVRV and Relative Valuation: Smart Contract Valuation and Altseason Triggers
Beyond Bitcoin, Ethereum (ETH) is the sole smart contract asset suitable for the MVRV framework.
Unlike Bitcoin's UTXO ledger, Ethereum operates on an account-balance model. It cannot track exactly "which coin rested for how many days before spending," meaning single-coin lifespan metrics like SOPR and CDD do not naturally apply. However, by weighting fiat transfer values across all accounts (via synthetic book-accounting used by institutions like CoinMetrics), one can calculate Ethereum's aggregate Realized Price and MVRV.
As Ethereum underpins DeFi, Layer 2 networks, and broad altcoin liquidity, observing ETH MVRV individually—and relative to BTC MVRV—serves as an essential barometer for market risk appetite and "Altseason" emergence:
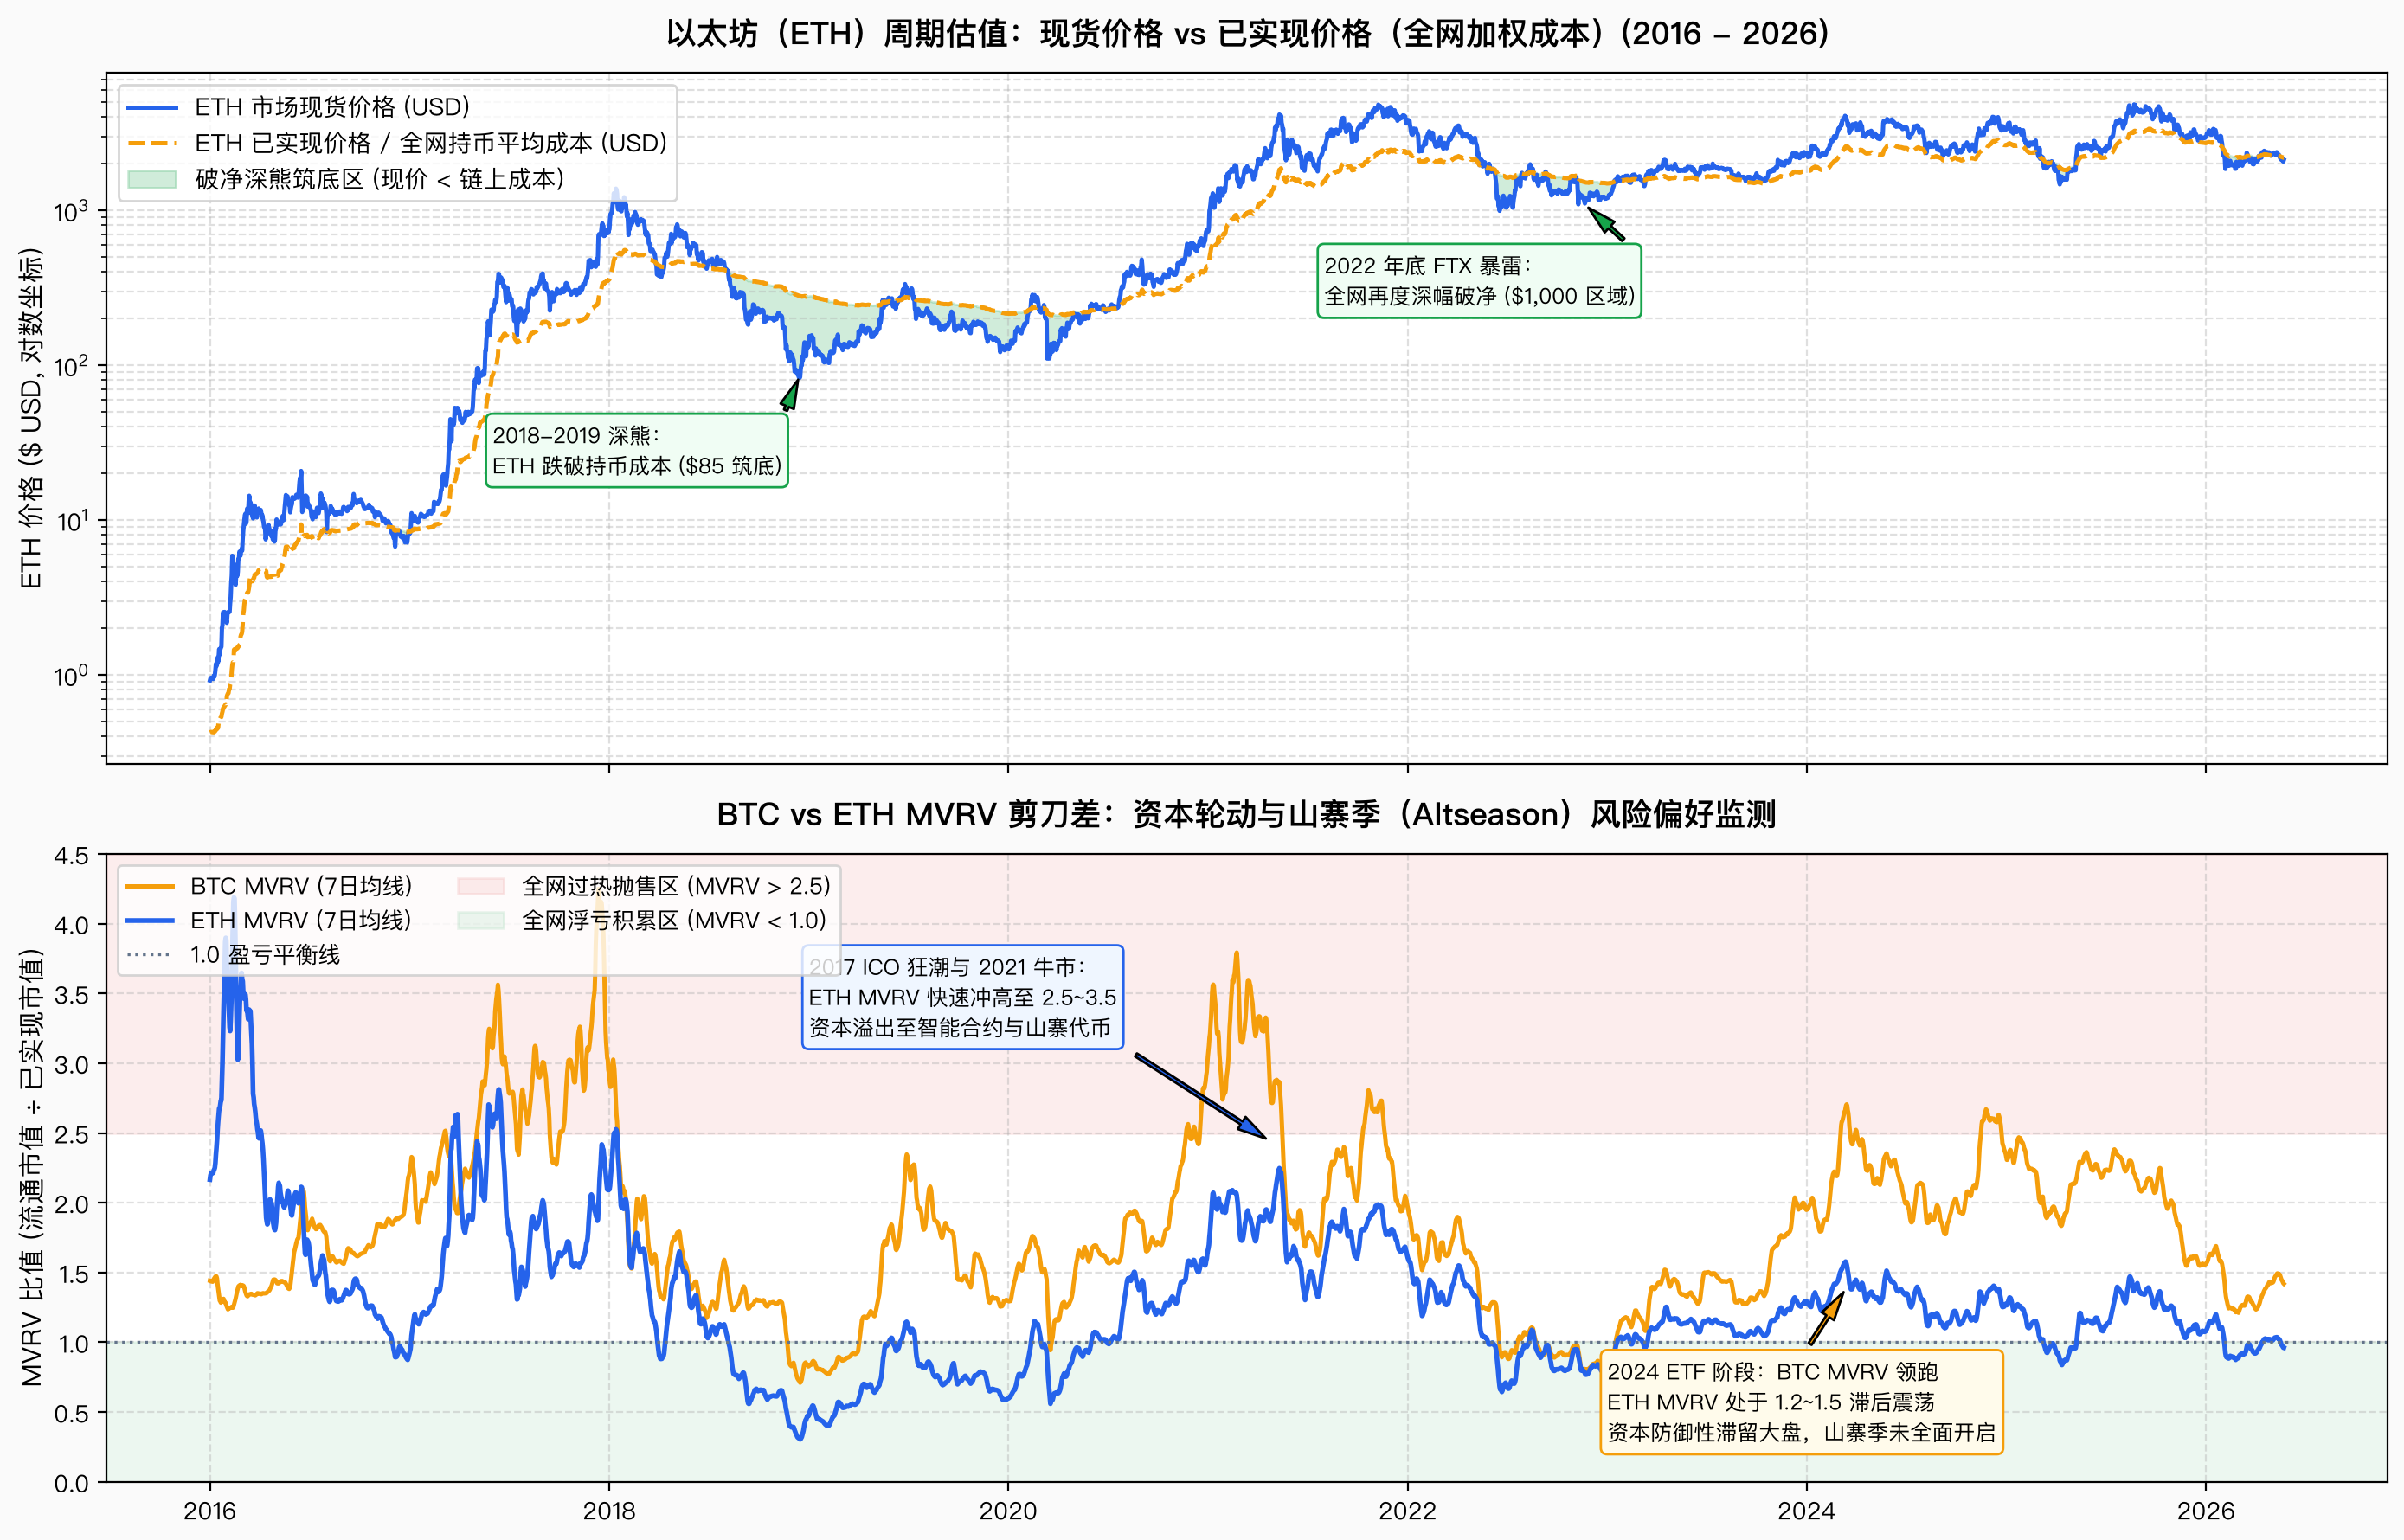
- Deep Value Accumulation (ETH MVRV < 1.0): Spot price sits below average network holding cost. In late 2018–early 2019 ($85 ETH), March 2020, and post-FTX late 2022 ($1,000 ETH), ETH MVRV dipped below 1.0, marking macro bottoms for smart contract assets.
- Capital Concentration in Bitcoin (BTC MVRV Leads, ETH Lags): BTC MVRV breaks out aggressively while ETH MVRV oscillates between 1.2 and 1.5. This indicates liquidity is concentrated in Bitcoin as institutional safety, with capital yet to rotate down the risk curve (e.g., the early 2024 spot ETF wave).
- Altseason and Risk Expansion (ETH MVRV Surges Above 2.5): As unrealized profits compound on Ethereum, ETH MVRV breaches 2.0 toward 2.5–3.5, closing its valuation gap against BTC. Capital spills over into Layer 2s and high-beta altcoins, matching the 2017 ICO wave, 2020 DeFi Summer, and spring 2021 altseason.
3. SOPR (Spent Output Profit Ratio)
SOPR measures the ratio between the fiat value of spent outputs on a given day and their fiat value when created:
SOPR uses 1.0 as the breakeven baseline:
- SOPR > 1.0: On-chain transferors are selling at an aggregate profit.
- SOPR < 1.0: On-chain transferors are selling at an aggregate loss.
SOPR exhibits clear support and resistance dynamics around 1.0:
- Pullbacks in Uptrends: SOPR bounces off 1.0, showing holders refuse to sell at a loss once reaching their cost basis, constraining circulating supply.
- Rallies in Downtrends: SOPR meets resistance at 1.0, as underwater holders exit upon breaking even, creating immediate sell pressure.
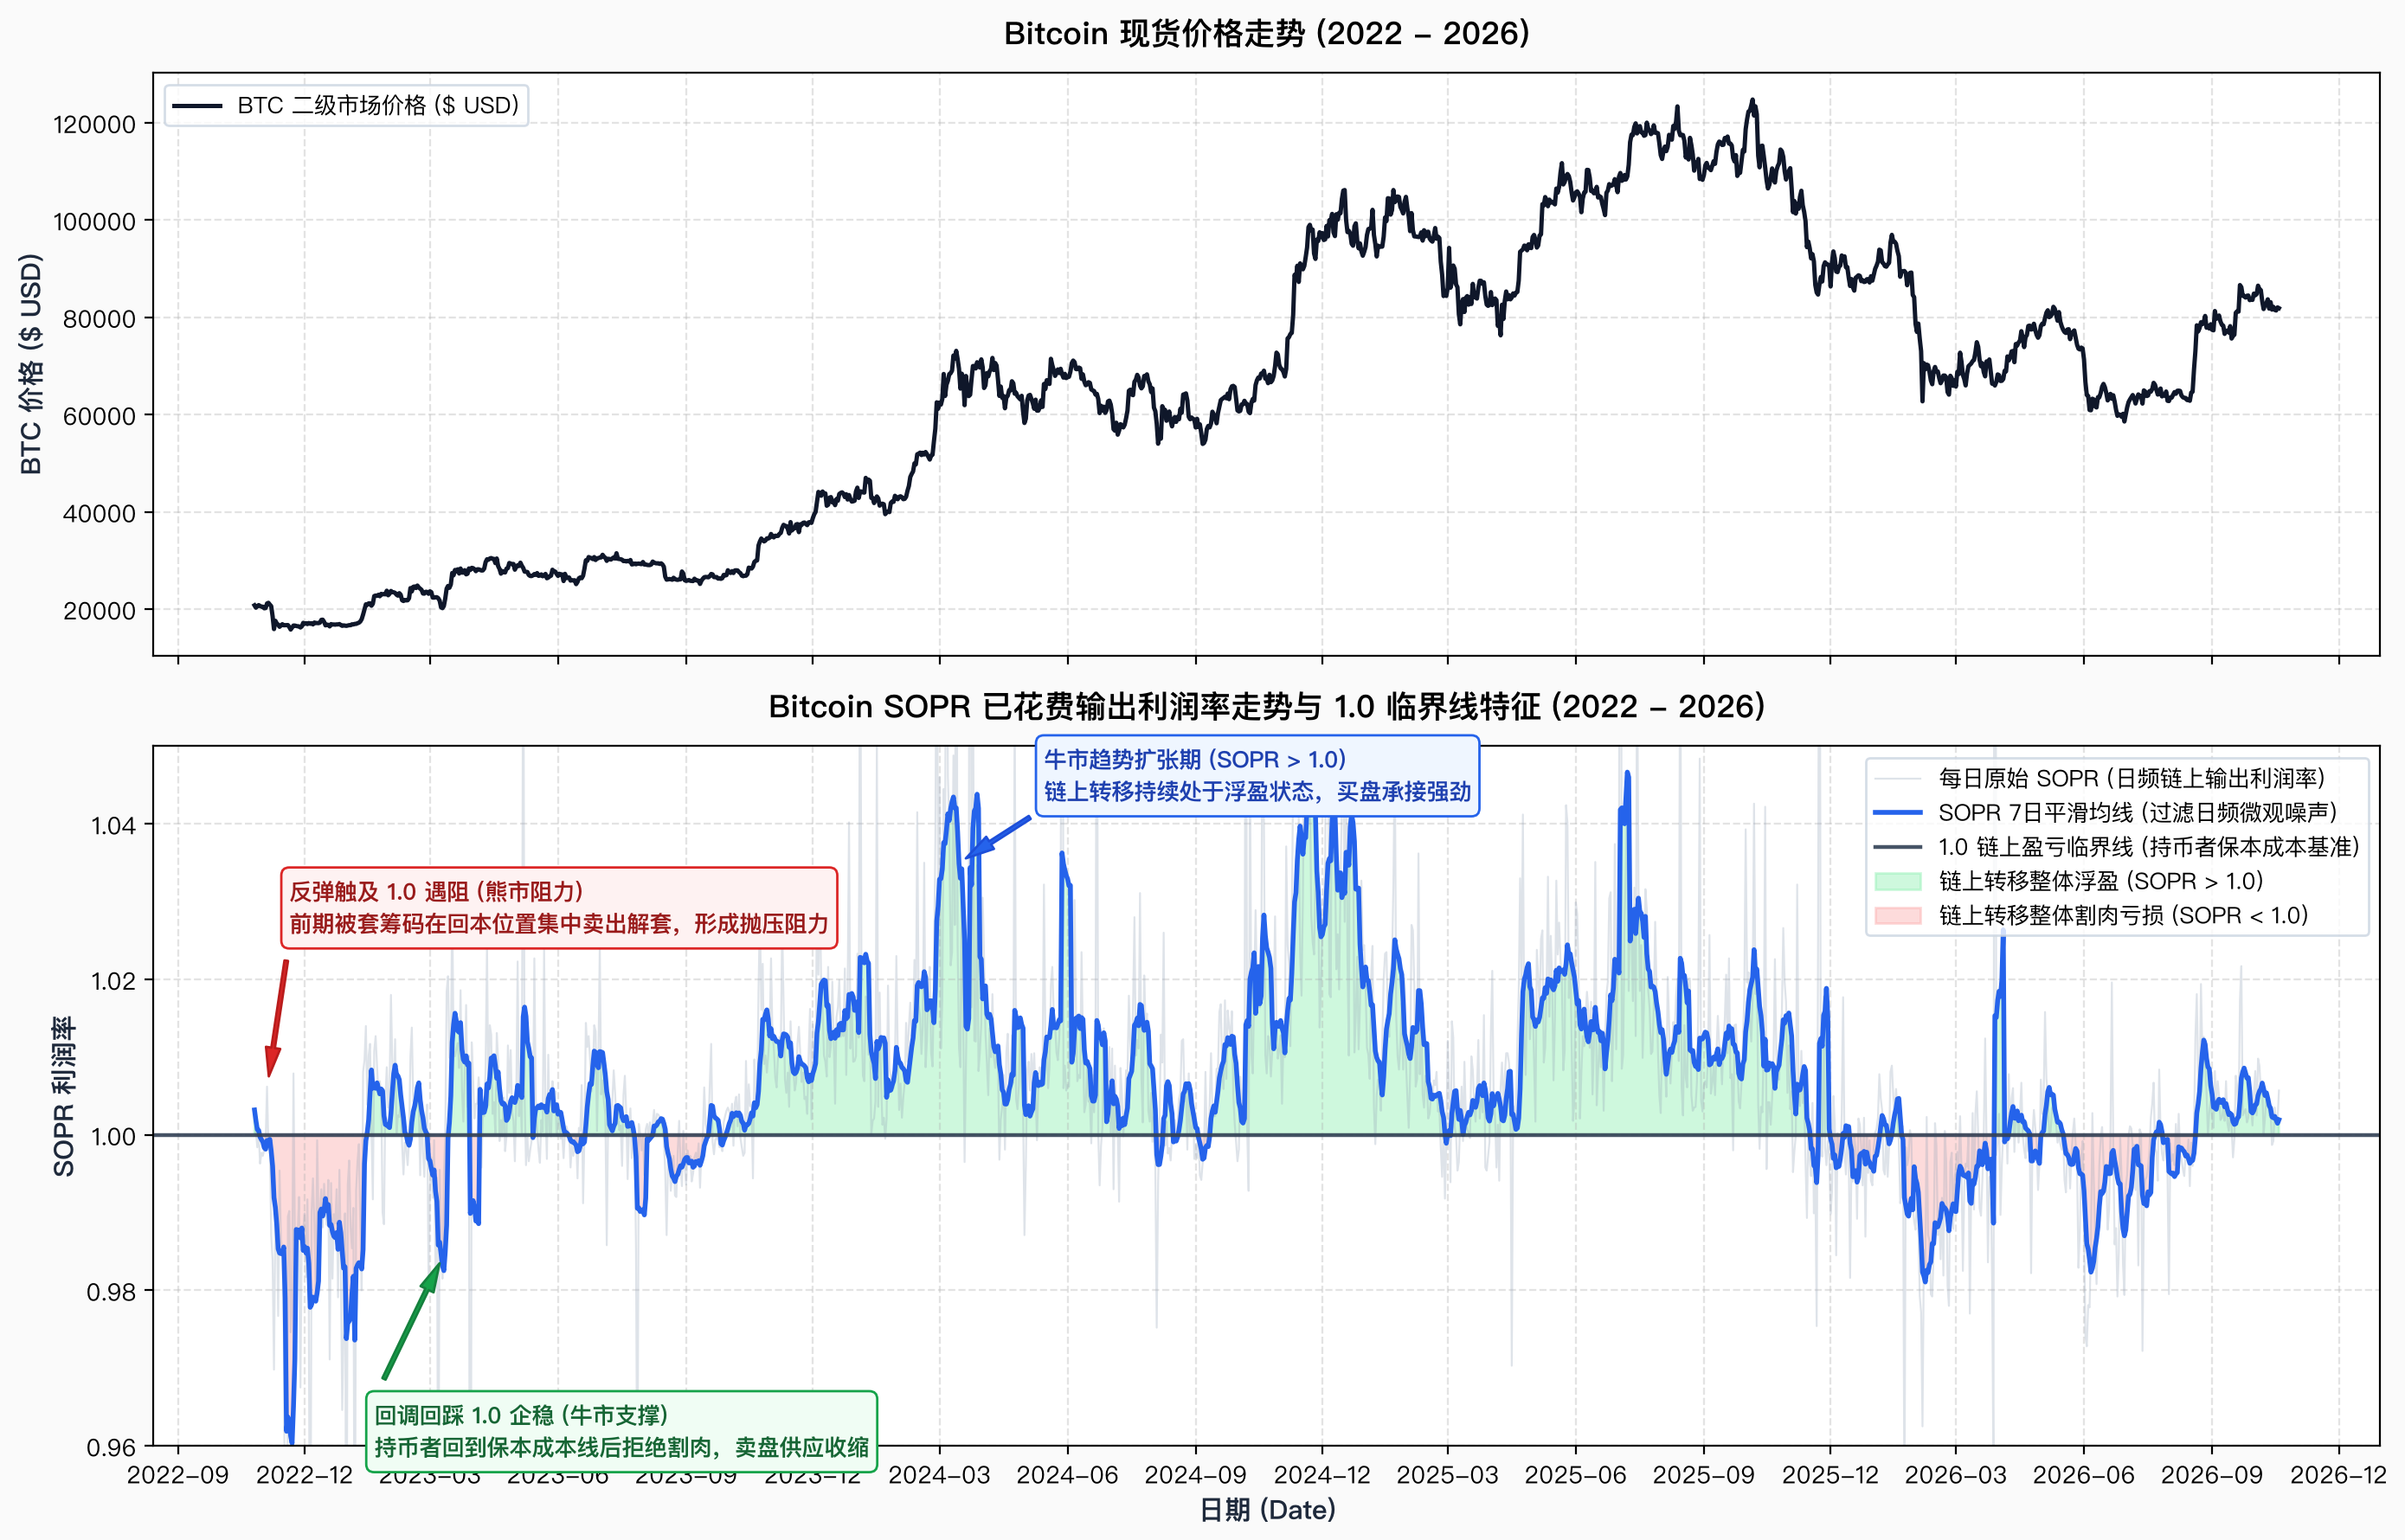
Practitioners rely on aSOPR (Adjusted SOPR), which discards outputs with a lifespan under one hour, removing noise from intermediary change addresses and high-frequency arbitrage bots.
SOPR's main limitation lies in its sensitivity to internal exchange rebalancing and UTXO consolidations, requiring entity-level label filtering.
4. CDD (Coin Days Destroyed)
CDD equals the number of coins moved in a transaction multiplied by the number of days they lay dormant on-chain:
For instance, 100 BTC dormant for 1,000 days generates 100,000 Coin Days Destroyed upon transfer. Long-dormant coins typically belong to early miners or long-term institutional holders.
- Baseline: Network CDD stays low and flat during standard market conditions.
- Spike Anomalies: Dramatic vertical spikes signal the reactivation and transfer of vintage coins, pointing to institutional rebalancing or incoming secondary market supply.
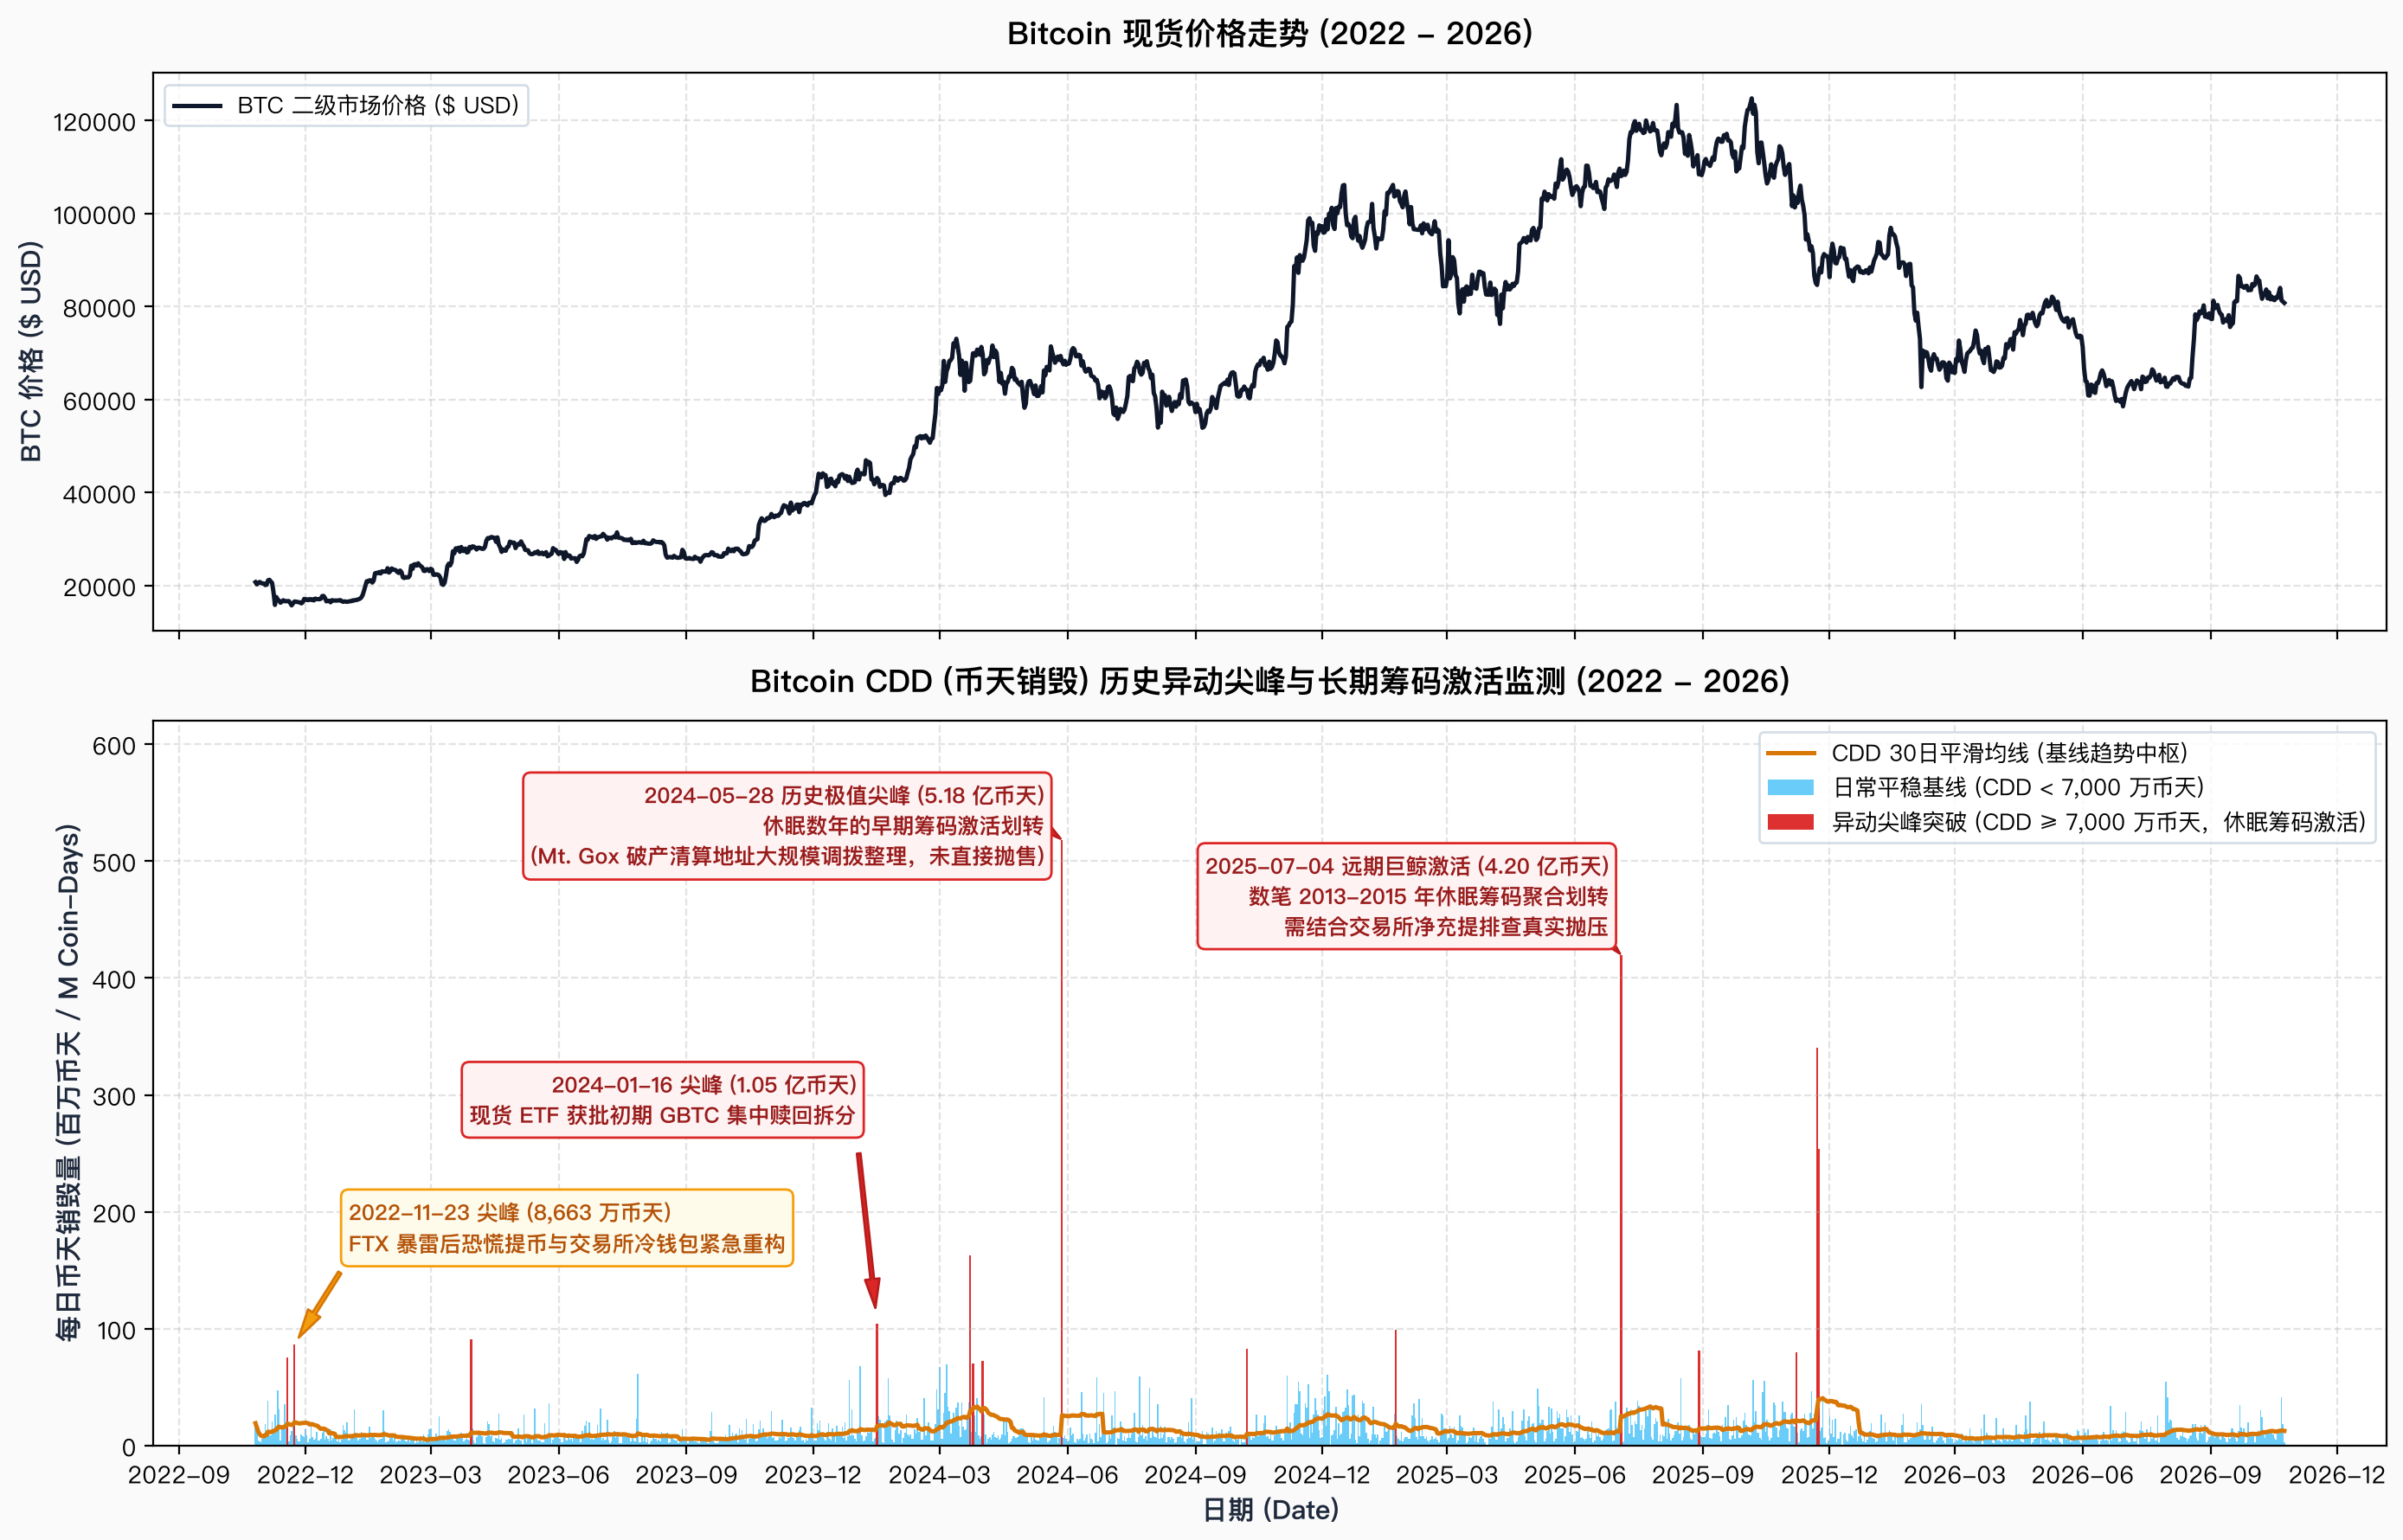
When interpreting CDD spikes, analysts must verify the recipient counterparty. Transfers to custody migrations, cold-storage reorganizations, or staking contract upgrades represent technical maintenance rather than market selloffs.
5. Institutional and Derivatives Flow Data
Beyond native on-chain metrics, two external capital signals provide tactical market context:
- Spot ETF Net Inflow: Tracks institutional fiat capital flows through regulated vehicles. Issuers publish net creation/redemption data following US market close, which subsequently settles via custodians like Coinbase Prime. Multi-day sustained net inflows mirror institutional asset allocation.
- Liquidation Heatmaps: Model estimated liquidation clusters across price bands in derivatives markets. Because cascading margin calls trigger forced market orders and market makers seek counterparty liquidity at liquidation pools, prices frequently gravitate toward dense liquidation zones. These maps represent synthetic orderbook models rather than deterministic on-chain orders.
| Metric | Calculation & Input | Core Thresholds | Time Horizon | Limitations & Pitfalls |
|---|---|---|---|---|
| BTC MVRV / Z-Score | Market Cap ÷ Realized Cap | Z-Score > 5–7 (Overheated); < 0 (Macro Bottom) | Multi-quarter/annual | Left-side cyclical metric; off-chain CEX turnover excluded |
| ETH MVRV & Relative Ratio | ETH Market Cap ÷ Realized Cap vs BTC | MVRV < 1.0 (Undervalued); > 2.5 + outperforming BTC (Altseason) | Weekly/Monthly | Account-balance model relies on synthetic accounting; staking lockups distort cost |
| SOPR / aSOPR | Spent value ÷ Created value (Excl. < 1h) | 1.0 threshold; support in bull markets, resistance in bear | Daily/Weekly | Only applies to UTXO chains; distorted by exchange wallet management |
| CDD (Coin Days Destroyed) | Coin volume × Dormant days | Relative spikes against baseline (e.g. ≥ 70M coin-days) | Daily anomaly alerts | Only applies to UTXO chains; must filter custodial migrations |
| Spot ETF Net Inflow | Daily net subscription/redemption USD | Consecutive days of sustained large net inflow | Daily tracking | Carries 1 trading-day settlement lag |
| Liquidation Heatmap | Estimated leveraged positions and margin calls | High-density liquidation clusters | Intraday/tactical | External simulated model, not deterministic on-chain orders |
02 Inherent Blockchain Traits: Average Trade Size vs Frequency
When evaluating individual public blockchains, analysts often mistake permanent architectural characteristics for dynamic ecosystem growth.
Due to consensus mechanisms, block intervals, and gas pricing structures, chains exhibit vastly different baseline transaction counts and trade sizes.
The data below captures on-chain DEX trade snapshots collected across major chains on September 23, 2026 (spanning full dex.trades and dex_solana.trades records):
| Blockchain | 24h DEX Volume | Covered Volume Share | 24h Swap Count | 24h Active Traders | Estimated Avg Trade Size |
|---|---|---|---|---|---|
| Solana | $1.766 Billion | 22.76% | 18.75 Million | 652,000 | ~$94 |
| BNB Chain | $1.560 Billion | 20.11% | 6.15 Million | 371,000 | ~$253 |
| Ethereum Mainnet | $1.529 Billion | 19.71% | 395,000 | 37,800 | ~$3,870 |
| Base | $834 Million | 10.75% | 1.77 Million | 64,600 | ~$471 |
| Arbitrum | $187 Million | 2.42% | 403,000 | 11,900 | ~$464 |
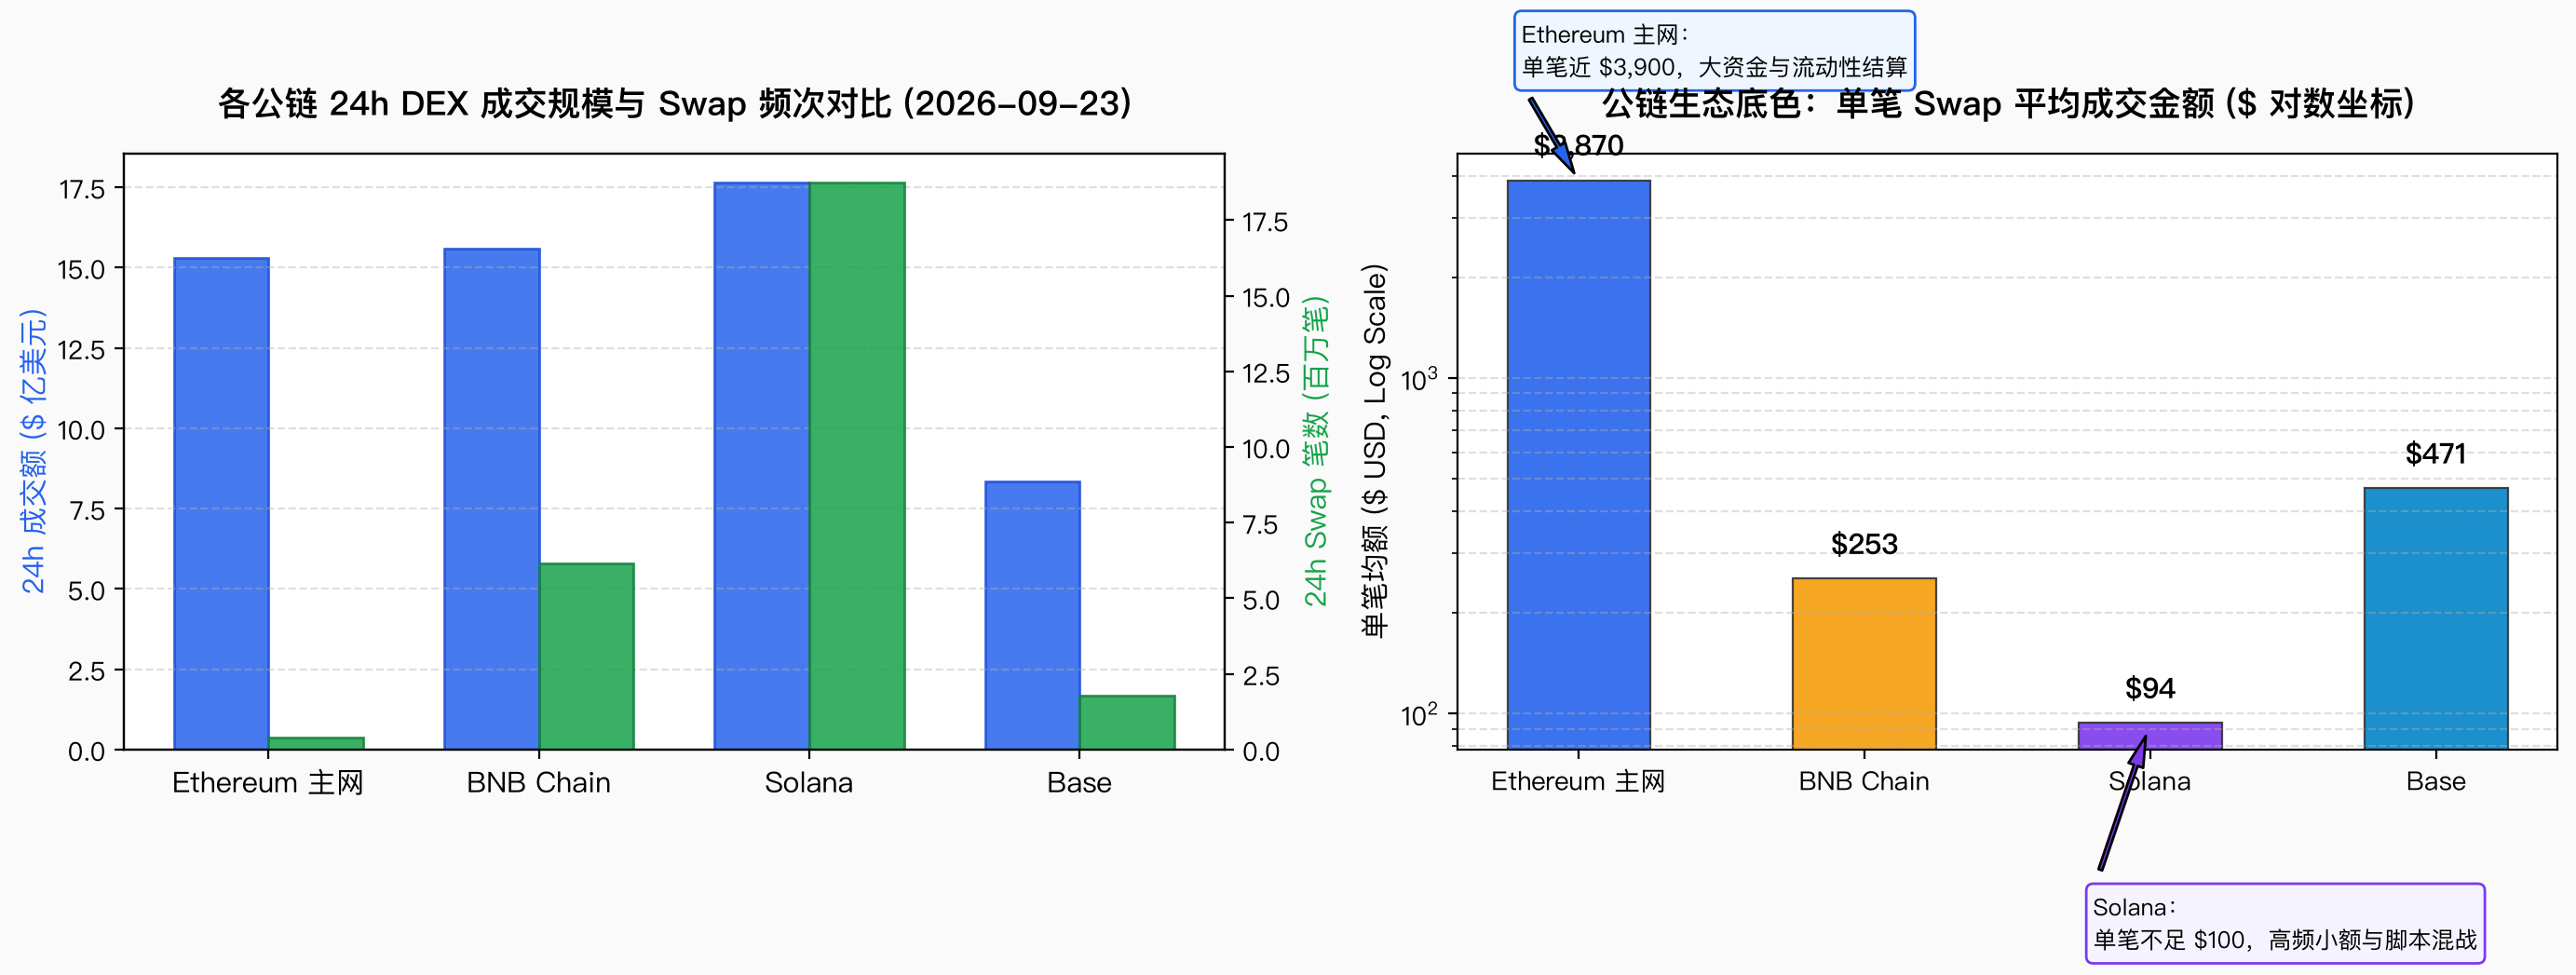
This comparison highlights distinct structural personas:
Ethereum Mainnet logged $1.529B in 24h volume across just 395k swaps and 37.8k active traders, with an average swap size of nearly $3,900. High base gas fees push small transactions to Layer 2s, leaving mainnet as an institutional settlement layer for large swaps, liquidity provision, and treasury transfers.
Solana recorded a comparable $1.766B in volume over the same period, but through a staggering 18.75M swaps, averaging less than $100 per trade. Sub-second block times and minimal gas invite programmatic arbitrage, small-dollar speculative meme trades, and frequent bot routing.
Base processed $834M across 1.77M swaps, averaging $471 per trade, leading EVM Layer 2s in decentralized liquidity turnover.
These differences stem from technical architectures and economic parameters. Solana's tens of millions of swaps do not mean its user base is 50x larger than Ethereum's; conversely, Ethereum's smaller address count does not reflect a dying ecosystem.
These static parameters represent the baseline profile of each network. Alone, they cannot indicate whether capital is actively flowing in or out today. Tracking an ecosystem requires observing dynamic, marginal change metrics.
03 Four High-Frequency Dynamic Metrics for Daily Monitoring
When monitoring an individual blockchain, four dynamic indicators best capture genuine marginal shifts: stablecoin net issuance, DEX volume-to-TVL ratio, volume vs active address divergence, and top asset volume concentration.
1. Stablecoin Net Issuance (Market Cap Change)
Many market participants rely on TVL (Total Value Locked). However, TVL includes native tokens (ETH, SOL, AVAX). When market prices rally, TVL expands mechanically without any new capital entering the chain.
Tracking 7-day and 30-day stablecoin net issuance filters out valuation bias. Stablecoins (USDT, USDC) reflect actual fiat capital deployed on-chain:
- Consistent Net Inflow: New capital bridges or mints into the ecosystem, providing dry powder.
- Consistent Net Outflow: Capital is draining, indicating that any TVL gains represent internal leverage rather than organic expansion.
2. DEX Volume / TVL Ratio (Capital Turnover Velocity)
The DEX volume-to-TVL ratio measures the capital efficiency and turnover velocity of locked assets:
- Stable Ratio (0.1 to 0.3) with Rising Stablecoins and TVL: Healthy organic expansion where liquidity matches trading demand.
- Flat or Falling TVL/Stablecoins but Spiking DEX Volume: In-network speculation rotating through isolated pairs, burning liquidity rapidly without external inflows.
3. Volume vs Active Address Divergence
Healthy network growth exhibits simultaneous expansion in both dollar volume and active participant addresses. Directional divergence signals anomalous on-chain manipulation.
Two divergence patterns frequently occur:
First, spiking trading volume alongside flat or declining unique traders. This points to concentrated wash-trading by isolated entities. In our September 23, 2026 audit, BNB Chain's pPOLY pool (0x9e0494c6b45955c6f97f485184206772a2f57777) generated $489M in weekly volume, yet the top 10 trader addresses accounted for 81.92% of all volume. This artificial churn does not represent authentic user demand.
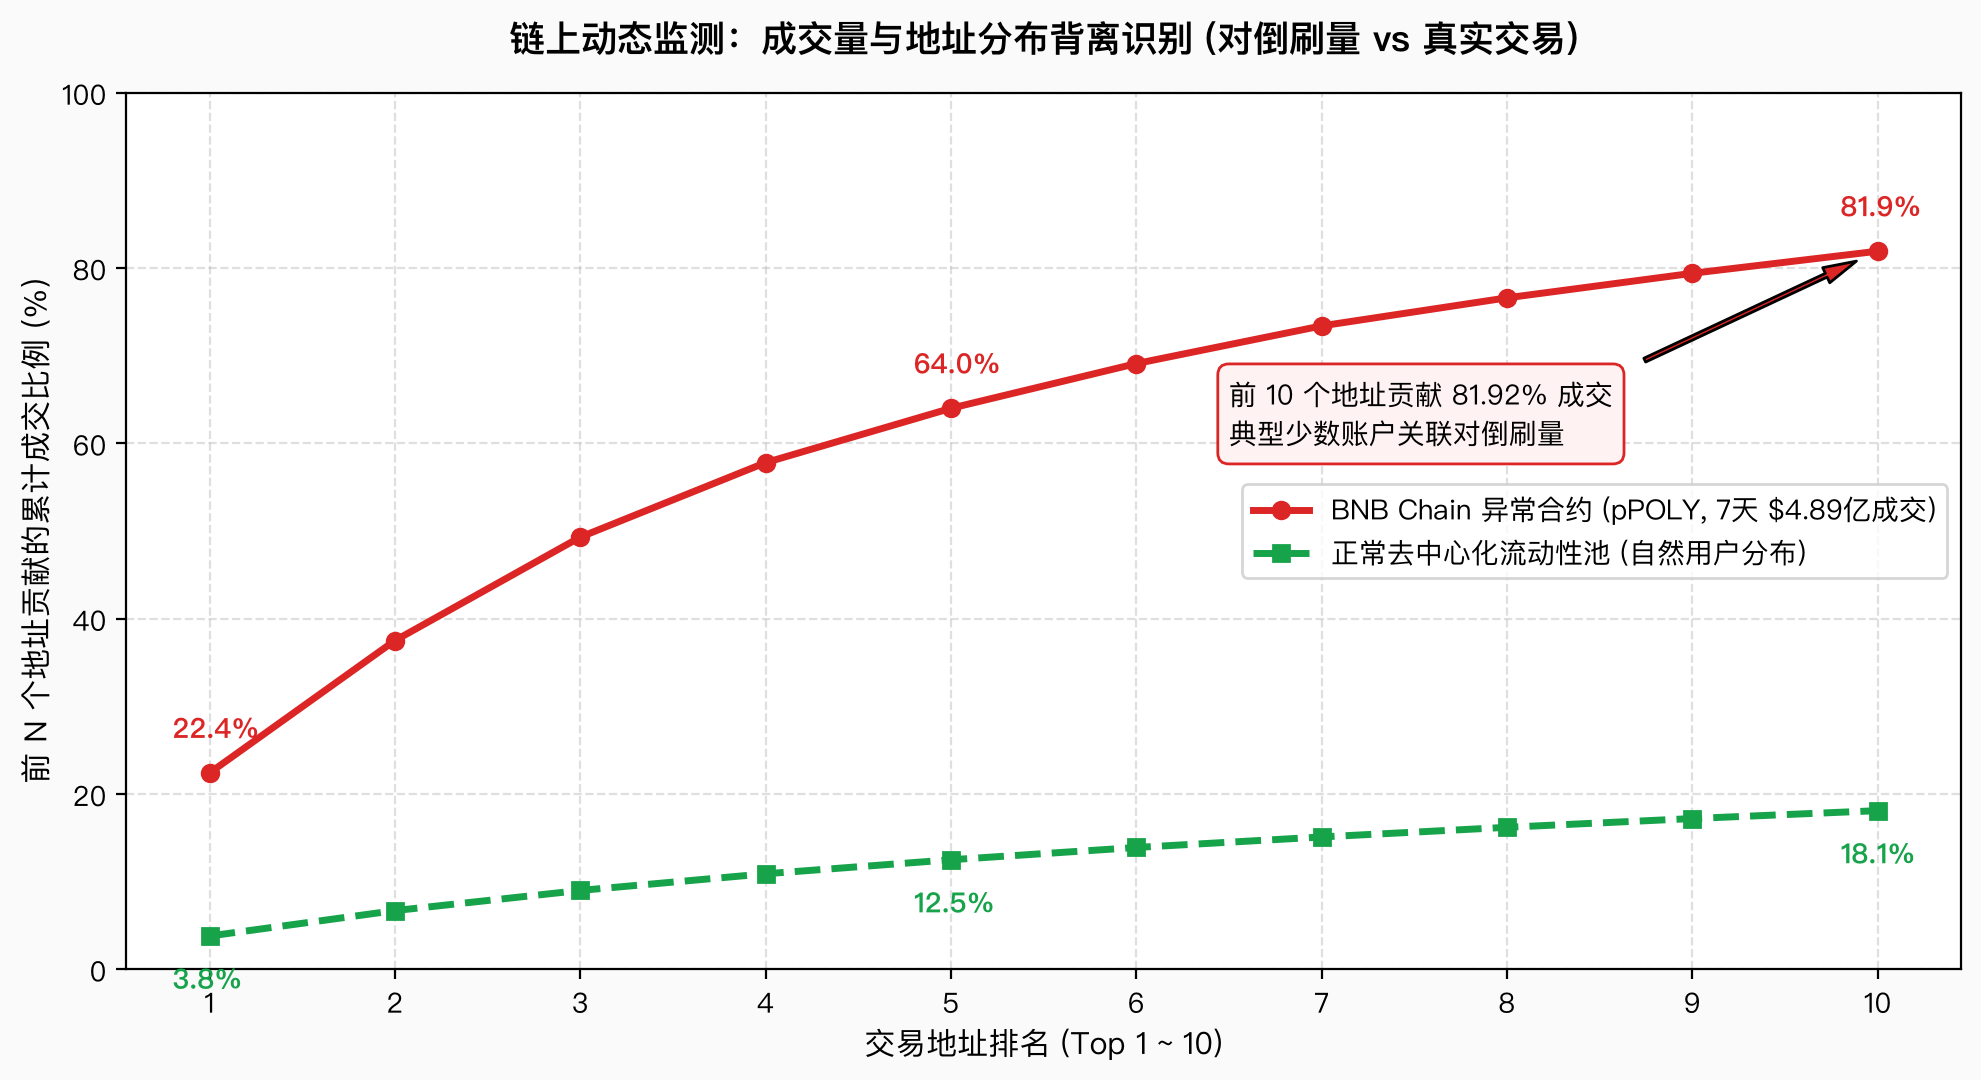
Second, spiking active addresses alongside negligible trading volume. Frequently seen on ultra-cheap Layer 2s and L1s, this reflects automated sybil scripts farming airdrops or batching micro-transfers, providing zero genuine market depth.
4. Top Token Concentration and Asset Breadth
Examining DEX volume distribution shows whether capital is consolidating into blue-chip settlement assets or circulating into speculative projects.
Track the volume share of the top 3–5 tokens alongside their asset profiles:
- Ethereum Mainnet: Heavily concentrated in blue-chip settlement pairs and regulated stablecoins. On September 23, outside of WETH and wrapped BTC (cbBTC/WBTC), trading was dominated by USDS ($281M over 3 days), PYUSD, RLUSD, UNI, and LINK.
- Base Ecosystem: High engagement in native protocol tokens. Data showed PEPE generating $59.3M, followed by AERO (Aerodrome DEX), VIRTUAL (AI agent concept), and VVV contributing $30M–$40M each.
- Solana Ecosystem: Driven by meme tokens and speculative launchpads. Top pairs included launchpad token PUMP ($49.2M over 3 days), cross-chain asset HYPE ($42.3M), and trending community tokens.
If a blockchain's volume depends entirely on one newly deployed token whose top 10 holders control over 80% of supply, liquidity is brittle and vulnerable to sharp drawdowns.
| Metric | Calculation & Focus | Bullish Signal | Warning / Anomaly |
|---|---|---|---|
| Stablecoin Net Issuance | 7d/30d change in circulating stablecoins | Steady positive expansion; external capital entering | TVL rising on price appreciation while stablecoin supply shrinks |
| DEX Volume / TVL Ratio | 24h DEX volume ÷ Total TVL | Moderate ratio growth accompanied by rising TVL | Multiple-fold surge in ratio while TVL stagnates (internal churn) |
| Volume vs Address Divergence | Growth in DEX volume vs unique active addresses | Coordinated, proportional expansion | Spiking volume with top 10 wallets > 80% share; or surging addresses with micro-volume |
| Top Token Concentration | Top 3–5 token share of DEX volume | Broad participation across settlement assets and new utility tokens | Complete dependency on a single unvetted token launched under 7 days ago |
04 Asset Boundaries and Framework Matrix
Analyzing on-chain data requires matching metric utility to asset mechanics and time horizons. No single tool fits every market participant.
1. Asset Classes and Metric Matrix
| Asset / Ecosystem | Monitoring Role | Applicable Core Metrics | Excluded Metrics & Reasons | Primary Data Sources |
|---|---|---|---|---|
| Bitcoin (BTC) | Macro market valuation anchor | MVRV Z-Score, SOPR 1.0 support, CDD vintage spikes, Spot ETF net flows | None. Complete UTXO ledger preserves pristine holding history | CoinMetrics Open Data + Public REST APIs |
| Ethereum (ETH) | Smart contract economy & Altseason gauge | ETH MVRV, Realized Price cost basis (MVRV < 1.0), BTC/ETH MVRV ratio | SOPR, CDD. Account-balance model cannot track coin-level spend lifecycles | CoinMetrics Open Data (eth.csv) |
| Solana & High-Throughput Chains | Tactical execution & speculative velocity | 24h DEX volume, USDC net flows, Volume/TVL turnover, Real fee burn | MVRV, SOPR, CDD. 70% locked staking and 80% vote-transaction noise pollute macro accounting | DefiLlama REST APIs |
| Altcoins / Memes / New Tokens | Idiosyncratic risk & anomaly screening | Top 10 holder cluster share, DEX turnover, Smart money net buy, Exchange outflows | All macro cyclical metrics. Short multi-week lifecycles distorted by insider vesting | DEX parsers and wallet database (whale.db) |
2. Decision Frequencies and Timeframes
- Macro Cyclical Indicators (BTC MVRV / SOPR / CDD, ETH MVRV): Review weekly or monthly. Establishes broad market positioning between macro undervaluation and cycle peaks. Intraday monitoring offers no predictive value.
- Capital Flows and Derivatives (Spot ETF Flows, Liquidation Maps): Monitor daily. Gauges sustained institutional accumulation and pinpoints tactical intraday liquidation bands.
- Chain Dynamic Metrics (Stablecoin Issuance, Turnover Velocity, Divergence): Use for active ecosystem surveillance. Filters out structural baseline noise and separates authentic capital inflows from wash-trading manipulation.
Data Sources
- BTC / ETH Macro History: CoinMetrics community datasets (
btc.csv,eth.csv, covering BTC from 2009 and ETH from 2015, archived locally indata/macro/btc_coinmetrics_raw.csvanddata/macro/eth_coinmetrics_raw.csv). - SOPR and CDD Time Series:
bitcoin-data.comopen API (daily records from 2021 to present, cached indata/macro/btc_sopr.jsonanddata/macro/btc_cdd.json). - Chain Dynamic Metrics: DefiLlama REST API (covering Solana and major chains for daily DEX volume, historical TVL, and stablecoin supply changes).
- DEX Market Snapshots: Dune Analytics on-chain query extracts collected September 23, 2026 04:44 UTC across Solana, BNB Chain, Ethereum Mainnet, Base, and Arbitrum.
- Derivatives and ETFs: Coinglass liquidation models and official daily fund reports.
- Local Analysis: SQLite database
data/whale.dband analysis charting scripts.
Disclaimer
This report is provided strictly for educational and blockchain data analysis research. It does not constitute investment advice, trading recommendations, or financial counsel. On-chain metrics and third-party statistics carry model estimation uncertainties, unwashed label noise, and reporting lags. Past performance and statistical patterns do not guarantee future returns.